The daily strength indicator RSI is moving upwards and is above its reference line indicating positive bias - Axis Securities

Follow us Now on Telegram ! Get daily 10 - 12 important updates on Business, Finance and Investment. Join our Telegram Channel
Nifty
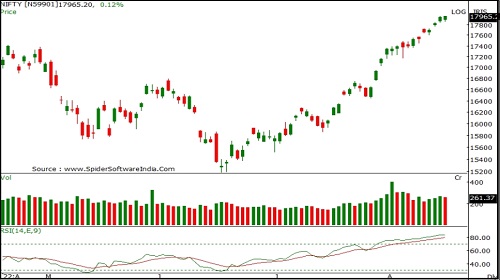
Nifty opened lower with a downward gap and observed profit booking in the first half however buying support at lower levels pulled the index higher to close near the day's high. Nifty closed at 17957 with a gain of 12 points.
On the daily chart index has formed a bullish candle forming higher High-low compared to previous session indicating positive bias. The index is moving in a Higher Top and Higher Bottom formation on the daily chart indicating an uptrend. The chart pattern suggests that if Nifty crosses and sustains above 18000 level it would witness buying which would lead the index towards 18100-18200 levels. However if index breaks below 17850 level it would witness selling which would take the index towards 17800-17700. Nifty is trading above its 50, 100 and 200 day SMA which indicates positive bias in the short term. Nifty continues to remain in an uptrend for the short term, so buying on dips continues to be our preferred strategy.
The daily strength indicator RSI is moving upwards and is above its reference line indicating positive bias.
The trend deciding level for the day is 17925. If NIFTY trades above this level then we may witness a further rally up to 18000-18040-18115 levels. However, if NIFTY trades below 17925 levels then we may see some profit booking initiating in the market, which may correct up to 17885-17810-17765 levels.
Banknifty
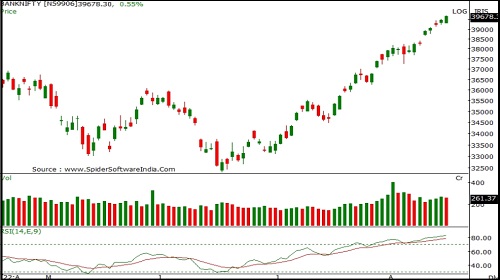
Banknifty opened lower with a downward gap and witnessed profit booking in the first half however buying momentum at lower levels pulled the index higher to close near the day's high. Banknifty closed at 39656 with a gain of 194 points.
On the daily chart index has formed a bullish candle and has closed above its previous session's high representing positive bias ahead. The index is moving in a Higher Top and Higher Bottom formation on the daily chart indicating a short term up trend. The chart pattern suggests that if Banknifty crosses and sustains above 39700 level it would witness buying which would lead the index towards 40000-40300 levels. However if the index breaks below 39600 level it would witness selling which would take the index towards 39300-38700. Banknifty is trading above 20, 50 , 100 and 200 day SMA indicating positive bias in the short to medium term. Banknifty continues to remain in an uptrend in the short term, so buying on dips continues to be our preferred strategy.
The daily strength indicator RSI is moving upwards and is above its reference line indicating positive bias.
The trend deciding level for the day is 39550. If BANK NIFTY trades above this level then we may witness a further rally up to 39810-39965-40220 levels. However, if BANK NIFTY trades below 39550 levels then we may see some profit booking initiating in the market, which may correct up to 39395-39140-38985 levels.
To Read Complete Report & Disclaimer Click Here
For More Axis Securities Disclaimer https://simplehai.axisdirect.in/disclaimer-home
SEBI Registration number is INZ000161633
Views express by all participants are for information & academic purpose only. Kindly read disclaimer before referring below views. Click Here For Disclaimer