The Nifty trend deciding level for the day is 15785 - Axis Securities

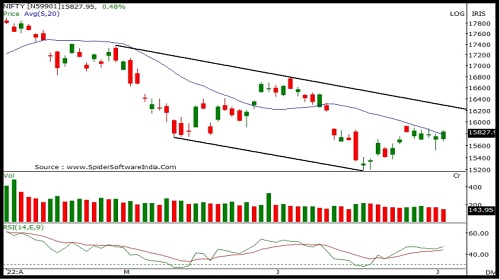
Nifty
Nifty opened sharply lower with a downward gap however buying support at lower levels pulled index higher to close in green. Nifty closed at 15835 with a gain of 83 points. On the daily chart index has formed a bullish candle and has closed above its previous session's high representing positive bias ahead. . The index is moving in a Lower Top and Lower Bottom formation on the daily chart indicating negative bias. The chart pattern suggests that if Nifty crosses and sustains above 15900 level it would witness buying which would lead the index towards 16000-16200 levels. However if the index breaks below 15800 level it would witness selling which would take the index towards 15700-15600. Nifty is trading above its 20 day SMA which indicates positive bias in the short term. Nifty continues to remain in a downtrend in the short to medium term, so selling on rallies continues to be our preferred strategy. The daily strength indicator RSI has turned positive from the oversold territory and is above its reference line indicating positive bias. The trend deciding level for the day is 15785. If NIFTY trades above this level then we may witness a further rally up to 15905-15975-16095 levels. However, if NIFTY trades below 15785 levels then we may see some profit booking initiating in the market, which may correct up to 15715-15595-15525 levels.
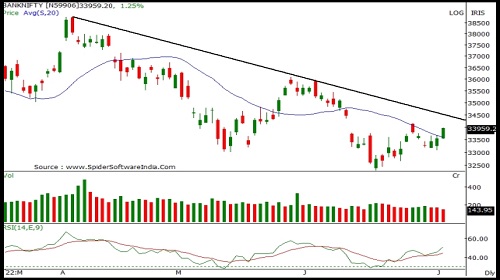
Bank Nifty
Banknifty opened on a flat note but buying momentum throughout the session led the index to close near the day's high. Banknifty closed at 33941 with a gain of 401 points. On the daily chart index has formed a bullish candle and has closed above its previous session's high representing positive bias ahead. The index is moving in a Lower Top and Lower Bottom formation on the daily chart indicating negative bias. The chart pattern suggests that if Banknifty crosses and sustains above 34000 level it would witness buying which would lead the index towards 34300-34600 levels. However if index breaks below 33800 level it would witness selling which would take the index towards 33600-33500. Banknifty is trading above 20 day SMA's indicating positive bias in the short to medium term. Banknifty continues to remain in a downtrend in the short to medium term, so selling on rallies continues to be our preferred strategy. The daily strength indicator RSI has turned positive from oversold and is above its reference line indicating sustained strength. The trend deciding level for the day is 33810. If BANK NIFTY trades above this level then we may witness a further rally up to 34110-34275-34570 levels. However, if BANK NIFTY trades below 33810 levels then we may see some profit booking initiating in the market, which may correct up to 33645-33350-33180 levels.
To Read Complete Report & Disclaimer Click Here
For More Axis Securities Disclaimer https://simplehai.axisdirect.in/disclaimer-home
SEBI Registration number is INZ000161633
Views express by all participants are for information & academic purpose only. Kindly read disclaimer before referring below views. Click Here For Disclaimer