The daily strength indicator RSI is moving upwards and is above its reference line indicating positive bias - Axis Securities

Follow us Now on Telegram ! Get daily 10 - 12 important updates on Business, Finance and Investment. Join our Telegram Channel
Nifty
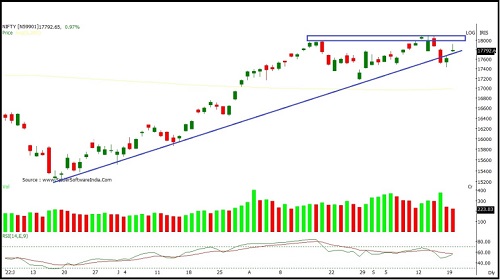
Nifty opened with an upward gap and remained in positive terrain throughout the day. However profit booking was witnessed in the last hour of trade. Nifty closed at 17816 with a gain of 194 points.
On the daily chart the index has formed a small Bullish candle with upper shadow indicating selling pressure as well as resistance at higher levels. The index is moving in a Higher Top and Higher Bottom formation on the daily chart indicating a sustained up trend. The chart pattern suggests that if Nifty crosses and sustains above 17900 level it would witness buying which would lead the index towards 18000-18100 levels. Important Support for the day is around 17700 However if index sustains below 17700 then it may witness profit booking which would take the index towards 17600-17500 levels.. Nifty is trading above 20, 50, 100 and 200 day SMA indicating positive bias in the short to medium term. Nifty continues to remain in an uptrend for the short term, so buying on dips continues to be our preferred strategy.
The daily strength indicator RSI is at the verge of crossover above its reference line. Crossing above the reference line will turn bias positive.
The trend deciding level for the day is 17825. If NIFTY trades above this level then we may witness a further rally up to 17910-18000-18085 levels. However, if NIFTY trades below 17825 levels then we may see some profit booking initiating in the market, which may correct up to 17735-17650-17560 levels
Banknifty
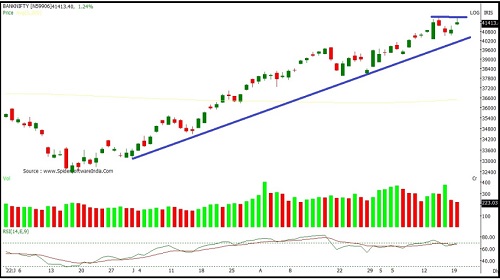
Banknifty opened with an upward gap and remained in positive terrain throughout the day. However, the index witnessed profit booking in the last hour of trade. Banknifty closed at 41468 with a gain of 564 points.
On the daily chart the index has formed a small Bullish candle with upper shadow indicating selling pressure as well as resistance at higher levels. The index is moving in a Higher Top and Higher Bottom formation on the daily chart indicating a short term up trend. The chart pattern suggests that if Banknifty crosses and sustains above 41500 level it would witness buying which would lead the index towards 41650-41900 levels. Important Support for the day is around 41200 However if index sustains below 41200 then it may witness profit booking which would take the index towards 41000-41900 levels.. Banknifty is sustaining above its 20, 50, 100 and 200- day SMA which signals bullish sentiments in near term. Banknifty continues to remain in an uptrend in the medium and long term, so buying on dips continues to be our preferred strategy.
The daily strength indicator RSI is moving upwards and is above its reference line indicating positive bias.
The trend deciding level for the day is 41450. If BANK NIFTY trades above this level then we may witness a further rally up to 41695-41920-42165 levels. However, if BANK NIFTY trades below 41450 levels then we may see some profit booking initiating in the market, which may correct up to 41225- 40980-40755 levels
To Read Complete Report & Disclaimer Click Here
For More Axis Securities Disclaimer https://simplehai.axisdirect.in/disclaimer-home
SEBI Registration number is INZ000161633
Views express by all participants are for information & academic purpose only. Kindly read disclaimer before referring below views. Click Here For Disclaimer


More News

The Bank Index had a promising start to the session and during the first half - Angel One