320-x-100_uti_gold.jpg" alt="Advertisement">

The daily strength indicator RSI continue to remian flat - Axis Securities

Follow us Now on Telegram ! Get daily 10 - 12 important updates on Business, Finance and Investment. Join our Telegram Channel
Nifty
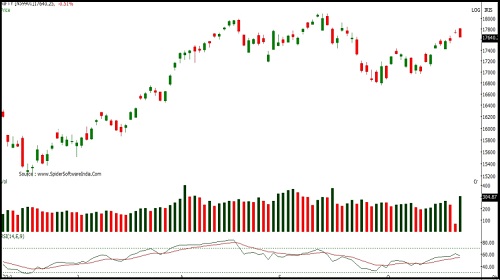
Nifty opened with an upward gap but witnessed selling from the opening tick to end on a negative note. Nifty closed at 17656 with a loss of 74 points.
On the daily chart the index has formed a sizable bearish candle and has closed below previous session's low indicating negative bias.. The index is moving in a Higher Top and Higher Bottom formation on the daily chart indicating sustained up trend. The chart pattern suggests that if Nifty crosses and sustains above 17700 level it would witness buying which would lead the index towards 17800-17900 levels. Important Supports for the day is around 17600 However if index sustains below 17600 then it may witness profit booking which would take the index towards 17500-17400 levels.. Nifty is trading above 20, 50, 100 and 200 day SMA's indicating positive bias in the short to medium term. Nifty continues to remain in an uptrend for the short term, so buying on dips continues to be our preferred strategy
The daily strength indicator RSI continue to remian flat and is above its reference line indicating absence of momentum on either side
The trend deciding level for the day is 17700. If NIFTY trades above this level then we may witness a further rally up to 17765-17875-17940 levels. However, if NIFTY trades below 17700 levels then we may see some profit booking initiating in the market, which may correct up to 17590-17525-17415 levels
Banknifty
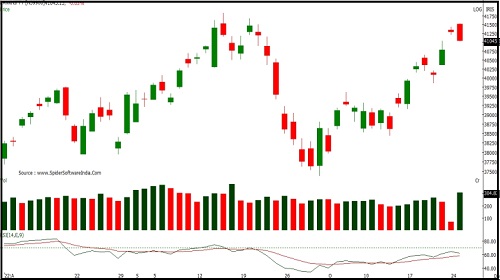
Banknifty opened with an upward gap but witnessed selling from the opening tick to close on a negetive note. Banknifty closed at 41123 with a loss of 182 points.
On the daily chart the index has formed a sizable bearish candle and voilated previous sesssion's low indicating further weakness. The index is moving in a Higher Top and Higher Bottom formation on the daily chart indicating short term up trend. The chart pattern suggests that if Banknifty crosses and sustains above 41300 level it would witness buying which would lead the index towards 41500-41700 levels. Important Supports for the day is around 41000 However if index sustains below 41000 then it may witness profit booking which would take the index towards 40800-40600 levels.. Banknifty is sustaining above its 20, 50, 100 and 200- day SMA which signals bullish sentiments in near term. Banknifty continues to remain in an uptrend in the medium and long term, so buying on dips continues to be our preferred strategy.
The daily strength indicator RSI continue to remian flat and is above its reference line indicating absence of momentum on either side
The trend deciding level for the day is 41225. If BANK NIFTY trades above this level then we may witness a further rally up to 41430-41735-41940 levels. However, if BANK NIFTY trades below 41225 levels then we may see some profit booking initiating in the market, which may correct up to 40920- 40715-40410 levels
To Read Complete Report & Disclaimer Click Here
For More Axis Securities Disclaimer https://simplehai.axisdirect.in/disclaimer-home
SEBI Registration number is INZ000161633
Views express by all participants are for information & academic purpose only. Kindly read disclaimer before referring below views. Click Here For Disclaimer


More News
Morning Market Quote : There is global support to the ongoing rally in the Indian market Say...