The daily price action formed a high wave candle with a bullish gap below its base (31722 -32144) - ICICI Direct

Follow us Now on Telegram ! Get daily 10 - 12 important updates on Business, Finance and Investment. Join our Telegram Channel
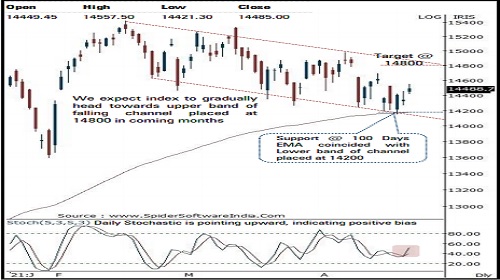
NSE (Nifty):14485
Technical Outlook
* On expected lines, buying demand emerged at lower band of channel. As a result, daily price action formed a bull candle carrying higher high-low, indicating extended pullback
* Going ahead, we reiterate our positive stance on the market and expect the index to gradually head towards upper band of falling channel placed at 14800 in coming months. In line with our view, The Bank Nifty staged a strong pullback that led the banking index to resolve above past two weeks high, indicating rejuvenation of upward momentum. We believe, follow through strength in banking would drive index higher as financials carry 38% weightage in Nifty
* Since March 2020, Nifty, Bank Nifty has maintained rhythm of not correcting more than 9% and 20% respectively. Past two months 8% correction in Nifty and 19% correction in Bank Nifty hauled both indices in the vicinity of their lower band of falling channel. The current elevated buying demand confirms that the aforementioned rhythm has been maintained. Thereby, expiry induces volatility from here on should be capitalised to accumulate quality large and mid caps as we expect stock specific action to continue amid ongoing Q4FY-21 result season
* The broader market indices have shown resilience by maintaining the rhythm of not correcting for more than average 10%, since March 2020, indicating robust price structure. Currently, both indices have corrected 8% from their 52 weeks high and forming a higher base above their 50 days EMA, which has been held since, June 2020, highlighting inherent strength. We expect both indices to regain momentum and gradually accelerate its relative outperformance against benchmark
* Structurally, key support is placed at 14200. Only the breach below 14200 would lead to extended correction towards key support of 13900-13800 range, as it is confluence of:
a) 80% retracement of the February rally (13596-15432), at 13963
b) 10% correction from life highs (15432) measures around 13900
* In the coming session, the index is likely to open on a flat note on the back of mixed global cues. We expect the index to trade with a positive bias while maintaining a higher high-low formation. Hence, use intraday dip towards 14440-14452 to create long for target of 14554.
NSE Nifty Weekly Candlestick Chart
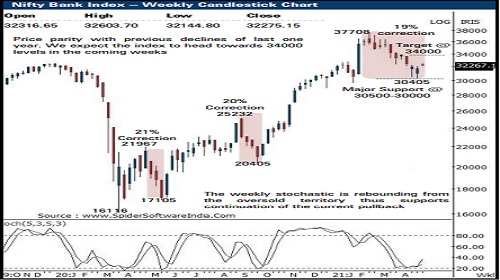
Nifty Bank: 32275
Technical Outlook
* The daily price action formed a high wave candle with a bullish gap below its base (31722 -32144 ) and also maintained higher high -low for a second consecutive session signalling positive bias and strong buying demand for the third consecutive session
* Going ahead, we reiterate our view that the downsides is limited in Banking index and we expect it to eventually head towards 34000 levels in the coming weeks as it is the confluence of the 50 % retracement of the entire decline (37708 -30405 ) and measuring implication of the last two weeks consolidation range (32325-30405).
* Key point to highlight is since March 2020 bottom, the index has maintained rhythm of not correcting for more than 20 % . In the current scenario, the index is seen forming higher base after correcting 19 % from the all -time high (37708 ) . Bank Nifty in the last two weeks has rebounded three times after testing the support area of 30500 . Hence the index is poised at crucial support and provides favourable risk -reward setup
* The index has strong support in the range of 30500 -30000 levels being the confluence of the following technical observations :
a) Price equality with the average of the previous two major correction in the last one year signals strong support around 30000 levels
b)The rising long term 200 days EMA is also placed around 29890 levels
* The weekly stochastic is rebounding from the oversold territory thus supports continuation of the current pullback in the coming sessions
* In the coming session, the index is expected to open on a flat note on the back of muted global cues . We expect the index to continue with its last three session pullback and continue to form higher high -low . Hence, use dips towards 32100 -32170 for creating long position for the target of 32380 , maintain a stoploss of 31980
Nifty Bank Index – Weekly Candlestick Chart
To Read Complete Report & Disclaimer Click Here
https://secure.icicidirect.com/Content/StaticData/Disclaimer.html
Views express by all participants are for information & academic purpose only. Kindly read disclaimer before referring below views. Click Here For Disclaimer


Tag News

Stock Picks : TCS Ltd And Chambal Fertiliser Ltd By ICICI Direct