The daily price action formed a bull candle with a long lower shadow signaling strong support at lower levels - ICICI Direct

Follow us Now on Telegram ! Get daily 10 - 12 important updates on Business, Finance and Investment. Join our Telegram Channel
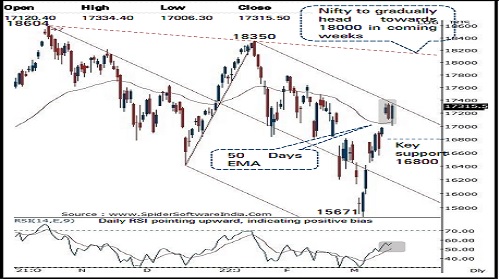
Nifty: 17315
Technical Outlook
• The Nifty started the session on a subdued note. However, buying demand from the psychological mark of 17000 coincided with 50 day’s EMA helping the index to recoup most of Monday’s losses and settle near the day’s high. As a result, daily price action formed a strong bull candle with small lower shadow, highlighting buying demand emerged at elevated support base. In the process, the index maintained the rhythm of not correcting for more than a single session seen over the past two weeks, highlighting strong upward momentum
• Going ahead, we expect the index to witness follow through strength amid broad based participation and gradually head towards 18000 in coming weeks as buying on decline strategy should continue to work in favour of market participants. Therefore, temporary breather should be capitalised on as incremental buying opportunity. Our target of 10800 is based on following observations:
• a) 80% retracement of entire corrective phase since October 2021 (18604-15671)
• b) Downward slanting trend line drawn adjoining OctoberJanuary highs (18604-18350)
• Structurally, the Nifty staged a strong rebound after forming a higher base above 52 weeks EMA. The formation of higher peak and trough signifies rejuvenation of upward momentum that makes us confident to revise support base at 16800 as it is 61.8% retracement of recent up move (16470-17353), placed at 16808
• The broader market indices have been forming a higher base above 52 weeks EMA that has set the stage to witness catch up activity with its large cap peers in coming weeks. Thus, focus should be on accumulating quality midcap stocks to ride next leg of up move In the coming session, index is likely to open on a positive note tracking buoyant global cues. We expect, the index to trade with a positive bias while forming a higher high-low and extend the ongoing up move. Hence use pullback towards 17365-17395 for creating long position for target of 17482
NSE Nifty Daily Candlestick Chart
Nifty Bank: 36348
Technical Outlook
• The daily price action formed a bull candle with a long lower shadow signaling strong support at lower levels as buying demand emerged on expected lines from the immediate support area of 35000 -35500 levels
• Going ahead, we expect the index to maintain positive bias and head towards the last week high of 36600 levels . Sustainability above 36600 will lead to extension of the current up move towards 38000 levels in the coming weeks being the 80 % retracement of the February -March decline (39424 -32155 )
• The overall bias in the index remain positive and any temporary dips should not be seen as negative, instead should be capitalized as buying opportunity in quality banking stocks .
• Structurally, buying demand emerged from the major support area of 32500 in the last two weeks and has lead to a formation of higher high-low in the weekly chart. This makes us confident to revise the support base higher towards 34000 levels being the confluence of :
• (a) 50 % retracement of the last two weeks up move (32155 - 36612 ) placed at 34300 levels
• (b) The bullish gap area of 10th March 2022 is also placed around 34000 levels
• Among the oscillators the weekly stochastic is in up trend thus supports overall positive bias in the index In the coming session, index is likely to open on a positive note amid firm global cues. We expect the index to trade with positive after a sharp pullback in the second half of yesterday session. Hence after a positive opening use intraday dips 36420-36490 for creating long position for target of 36740, maintain a stop loss at 36290
Nifty Bank Index – Weekly Candlestick Chart

To Read Complete Report & Disclaimer Click Here
https://secure.icicidirect.com/Content/StaticData/Disclaimer.html
Views express by all participants are for information & academic purpose only. Kindly read disclaimer before referring below views. Click Here For Disclaimer


Tag News

Stock Picks : TCS Ltd And Chambal Fertiliser Ltd By ICICI Direct


More News

Market is expected to open on flattish note and likely to witness sideways move during the d...