The chart pattern suggests that if Nifty crosses and sustains above 16000 level - Axis Securities

Follow us Now on Telegram ! Get daily 10 - 12 important updates on Business, Finance and Investment. Join our Telegram Channel
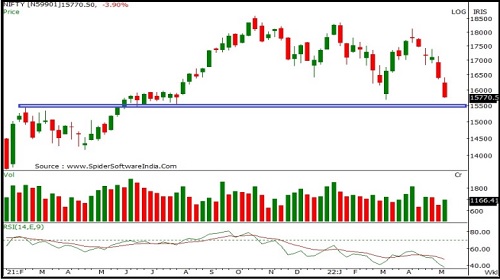
Nifty
Nifty started the week on a negative note and extended bearish sentiments for most part of the week dragged it lower to close in negative territory. Nifty closed at 15782 with a loss of 629 points on a weekly basis. On the weekly chart the index has formed a long bearish candle forming lower High-Low compared to previous week indicating weakness at current levels. The index is moving in a Lower Top and Lower Bottom formation on the weekly chart indicating negative bias. The chart pattern suggests that if Nifty crosses and sustains above 16000 level it would witness buying which would lead the index towards 16400-16700 levels. However if the index breaks below 15650 level it would witness selling which would take the index towards 15400-15100. On the daily chart, Nifty sustains below its 20, 100 and 200 day SMA indicating negative bias in the short term. Nifty continues to remain in a downtrend in the short to medium term, so selling on rallies continues to be our preferred strategy. For the week, we expect Nifty to trade in the range of 16300-15000 with a negative bias. The daily and weekly strength indicator RSI is moving downwards and is quoting below its reference line indicating negative bias. The trend deciding level for the day is 15870. If NIFTY trades above this level then we may witness a further rally up to 15995-16210-16340 levels. However, if NIFTY trades below 15870 levels then we may see some profit booking initiating in the market, which may correct up to 15655-15525-15310 levels.
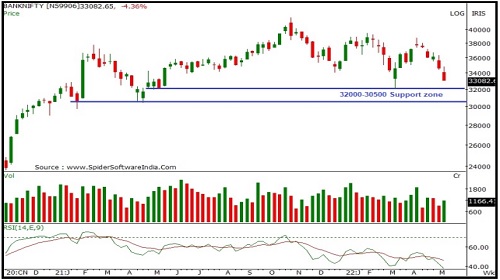
Bank Nifty
Bank Nifty started the week with a downward gap and selling pressure for most part of the week led it to close on a negative note. Bank Nifty closed at 33121 with a loss of 1470 points on a weekly basis. On the weekly chart the index has formed a long bearish candle forming lower High-Low compared to previous week and has closed below its low indicating weakness at current levels. The index is moving in a Lower Top and Lower Bottom formation on the weekly chart indicating negative bias. The chart pattern suggests that if Bank Nifty crosses and sustains above 34000 level it would witness buying which would lead the index towards 34800-35500 levels. However if index breaks below 33000 level it would witness selling which would take the index towards 32000-31500. Bank Nifty is trading below 20, 50, 100 and 200 day SMA which are important short term moving averages, indicating negative bias in the short to medium term. Bank Nifty continues to remain in a downtrend in the short to medium term, so selling on rallies continues to be our preferred strategy. For the week, we expect Bank Nifty to trade in the range of 34000-32000 with a negative bias. The daily and weekly strength indicator RSI is in bearish mode and sustaining below the 50 mark which supports bearish sentiments ahead. The trend deciding level for the day is 33375 If BANKNIFTY trades above this level then we may witness a further rally up to 33745-34370-34740 levels. However, if BANKNIFTY trades below 33375 levels then we may see some profit booking initiating in the market, it may correct up to 32750-32385-31760 levels.
To Read Complete Report & Disclaimer Click Here
For More Axis Securities Disclaimer https://simplehai.axisdirect.in/disclaimer-home
SEBI Registration number is INZ000161633
Views express by all participants are for information & academic purpose only. Kindly read disclaimer before referring below views. Click Here For Disclaimer


More News
Morning Market Quote : The market lacks clear direction Says Dr. V K Vijayakumar, Geojit Fin...