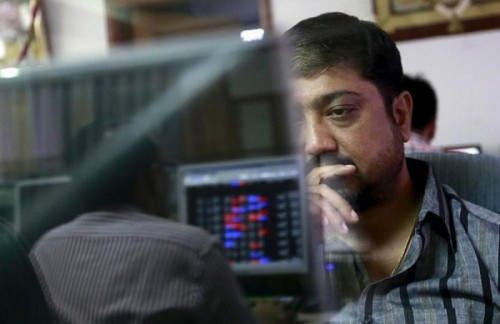
The Nifty started the session with a positive gap (16888-17121) and inched upward as intraday - ICICI Direct

Follow us Now on Telegram ! Get daily 10 - 12 important updates on Business, Finance and Investment. Join our Telegram Channel
Nifty : 17201
Technical Outlook
• The Nifty started the session with a positive gap (16888-17121) and inched upward as intraday throwbacks were bought into. As a result, daily price action formed a bull candle carrying higher high-low, highlighting pause in downward momentum. Consequently, index filled Monday’s bearish gap (17172-17054), indicating emergence of buying demand at lower levels
• The index is consolidating (17500-16800) and forming a higher base formation above key long term 200 days EMA. Key point to highlight is that, past three week consolidation helped weekly stochastic oscillator to cool off the overbought conditions and make market healthy while discounting earnings and volatile global cues. Going ahead, we expect Nifty to hold the key support threshold of 16800 and eventually head towards upper band of consolidation placed at 17500. Thus, dips should be capitalized to accumulate quality stocks in a staggered manner. On the upside, 17500 will continue to act as immediate resistance for the Nifty as it is confluence of:
• a) bearish gap recorded on April 18, 2022 placed in the range of (17475-17238)
• b) 50% retracement of April decline (18114-16825)
• The broader market indices are consolidating in the vicinity of 200 days EMA. Historically, in a secular bull market intermediate correction towards 200 days EMA help index to cool off the overbought condition and make market healthy. We believe, base formation from hereon would set the stage for next leg of up move amid ongoing Q4FY22 earning season
• Structurally, the formation of higher trough on the weekly chart signifies robust price structure highlighting strong support base at 16800 which we expect to hold on a closing basis as it is confluence of:
• A) 50% retracement of the entire March 2022
• B) 200 days EMA placed at 16850
NSE Nifty Daily Candlestick Chart

Nifty Bank: 36404
Technical Outlook
• The daily price action formed a high wave candle with a higher high -low signaling positive follow through to previous session counter bull candle as buying demand emerged around the major support area of 35500 -35000 levels .
• Going ahead, we expect the index to trade with positive bias while extending the ongoing consolidation in the broad range of 35000 -37300 levels amid stock specific activity as indicated by lack of faster retracement on either side
• On the higher side 37300 is likely to act as major hurdle being the confluence of the last Monday’s gap down area and the 50 % retracement of recent decline (38765 -35511 )
• Structurally, the current corrective decline is shaping out as a retracement of strong 20 % rally from March 2022 lows (32156 ) which will help the index to work out of overbought conditions in the weekly time frame . We expect the index to hold above the strong support area of 35500 -35000 levels as it is confluence of :
• (a) 61 . 8 % retracement of the entire March 2022 up move (32155 -38765 ) placed at 34800 levels
• (b) The rising 52 weeks EMA is also placed around 35500 levels
• (c ) The recent swing low of second half of March 2022 is also placed around 35000 levels
• Among the oscillators the weekly stochastic is seen cooling off from the overbought territory and is currently placed at a reading of 45 indicating prolongation of the current consolidation .
In the coming session, index is likely to open gap down tracking weak global cues . We expect the index to trade in a range with corrective bias . Hence after a negative opening use intraday pullback towards 36280 -36340 for creating short position for the target of 36030 , maintain a stoploss at 36460
Nifty Bank Index – Weekly Candlestick Chart

To Read Complete Report & Disclaimer Click Here
https://secure.icicidirect.com/Content/StaticData/Disclaimer.html
Above views are of the author and not of the website kindly read disclaimer


Tag News

Stock Picks : TCS Ltd And Chambal Fertiliser Ltd By ICICI Direct