The Nifty started the session on a positive note and continued its northbound journey as intraday dips were bought into - ICICI Direct

Follow us Now on Telegram ! Get daily 10 - 12 important updates on Business, Finance and Investment. Join our Telegram Channel
Nifty : 16871
Technical Outlook
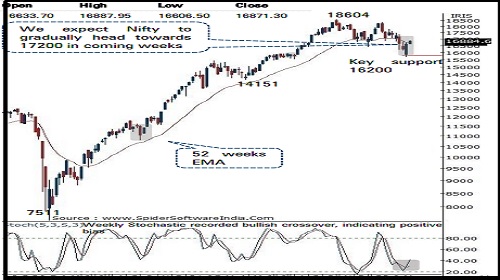
• The Nifty started the session on a positive note and continued its northbound journey as intraday dips were bought into, indicating inherent strength. As a result, daily price action formed a bull candle carrying higher high-low, indicating continuance of positive bias over fifth consecutive session. In the process, index settled above immediate hurdle of 16800 that augurs well for extended pullback
• The index has formed a higher high-low on the weekly chart after five weeks corrective phase, indicating resumption of up trend. Going ahead, we expect Nifty to extend the ongoing up move and head towards 17200-17300 in coming weeks as it is the 61.8% retracement of January-March decline (18350- 15672). However, we expect move towards 17200 would be in a non linear and gradual manner. Therefore, couple of days breather ahead of Fed meet and ongoing geopolitical issues should be capitalised as incremental buying opportunity by accumulating quality stocks
• Structurally, buying demand emerged from 52 weeks EMA, highlighting inherent strength. The formation of higher highlow on the weekly chart signifies rejuvenation of upward momentum that makes us confident to revise support base upward at 16200 as it is 61.8% retracement of current up move (15671-16887)
• In tandem with benchmark, the broader market indices bounced back and approached in the vicinity of 52 week EMA. We expect, the Nifty midcap and small cap indices to form a base around 52 weeks EMA in coming weeks that would set the stage for extended pullback In the coming session, index is likely to open on a flat note tracking mixed global cues. We expect index to trade with a positive bias while maintaining higher high-low formation. Thus, any pullback towards 16790-16825 should be used to create long position for target of 16913
NSE Nifty Daily Candlestick Chart
Nifty Bank: 35312
Technical Outlook
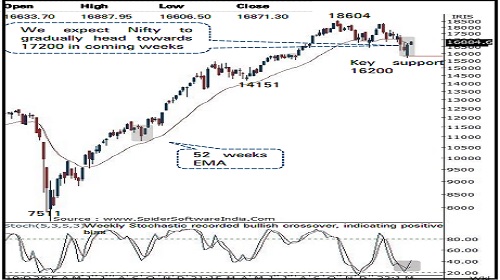
• The Nifty started the session on a positive note and continued its northbound journey as intraday dips were bought into, indicating inherent strength. As a result, daily price action formed a bull candle carrying higher high-low, indicating continuance of positive bias over fifth consecutive session. In the process, index settled above immediate hurdle of 16800 that augurs well for extended pullback
• The index has formed a higher high-low on the weekly chart after five weeks corrective phase, indicating resumption of up trend. Going ahead, we expect Nifty to extend the ongoing up move and head towards 17200-17300 in coming weeks as it is the 61.8% retracement of January-March decline (18350- 15672). However, we expect move towards 17200 would be in a non linear and gradual manner. Therefore, couple of days breather ahead of Fed meet and ongoing geopolitical issues should be capitalised as incremental buying opportunity by accumulating quality stocks
• Structurally, buying demand emerged from 52 weeks EMA, highlighting inherent strength. The formation of higher highlow on the weekly chart signifies rejuvenation of upward momentum that makes us confident to revise support base upward at 16200 as it is 61.8% retracement of current up move (15671-16887)
• In tandem with benchmark, the broader market indices bounced back and approached in the vicinity of 52 week EMA. We expect, the Nifty midcap and small cap indices to form a base around 52 weeks EMA in coming weeks that would set the stage for extended pullback In the coming session, index is likely to open on a flat note tracking mixed global cues. We expect index to trade with a positive bias while maintaining higher high-low formation. Thus, any pullback towards 16790-16825 should be used to create long position for target of 16913
NSE Nifty Daily Candlestick Chart
To Read Complete Report & Disclaimer Click Here
https://secure.icicidirect.com/Content/StaticData/Disclaimer.html
Views express by all participants are for information & academic purpose only. Kindly read disclaimer before referring below views. Click Here For Disclaimer






Tag News

Stock Picks : TCS Ltd And Chambal Fertiliser Ltd By ICICI Direct


More News
Market Wrap Up : The benchmark index Nifty surged from the lows and kept the momentum Says M...

