The Nifty has traded higher as expected but closed in red for the last session - Enrich Financial

Follow us Now on Telegram ! Get daily 10 - 12 important updates on Business, Finance and Investment. Join our Telegram Channel
https://t.me/InvestmentGuruIndiacom
Download Telegram App before Joining the Channel
NIFTY MORNING OUTLOOK
Pre-Market Thursday! Asian market negative trading, Nifty50 on the SGX were trading lower at 16735.50 - 165 points on indicating gap down opening for the NSE.
At the close in NSE, the Nifty 50 unchanged 0%, while the BSE Sensex 30 index unchanged 0%. The biggest gainers of the session on the Nifty 50 were Kotak Mahindra Bank Ltd., which unchanged 0% or 0 points to trade at 1820.85 at the close. Titan Company Ltd unchanged 0% or 0 points to end at 2422.05 and IndusInd Bank Ltd. was unchanged 0% or 0 points to 937.90 in late trade. Biggest losers included Oil and Natural Gas Corporation Ltd, which unchanged 0% or 0 points to trade at 164.45 in late trade. Hero MotoCorp Ltd unchanged 0% or 0 points to end at 2682.50 and NTPC Ltd 0% or 0 points to 129.90.
The breadth, indicating the overall health of the market, 2145 rose and 1128 declined, while 88 ended unchanged on the India National Stock Exchange.
Rupee desk: The USD/INR was unchanged 0% to 74.859.
Technical outlook
Nifty daily chart has formed "Descending broadening wedge" pattern. The Nifty has traded higher as expected but closed in red for the last session. Technically, Market volatility will be still prevalent. We expect to see a gap down today. The market is expected to continue on bearish momentum based on the current price action, once the same break below the current support level near 17000. The downside rally could be testing all the way up to 16850-16700 levels in the upcoming sessions. Alternatively, if the market struggles to break the support, then it might retest the same and revise the trend to bullish/sideways mode once again as long as the stiff resistance holds near
17200. A slide to 17350-17500 is also a possibility if the price makes or break above the current resistance level.
Technical Chart

To Read Complete Report & Disclaimer Click Here
For More Axis Securities Disclaimer https://simplehai.axisdirect.in/disclaimer-home
SEBI Registration number is INZ000161633
Above views are of the author and not of the website kindly read disclaimer


Top News
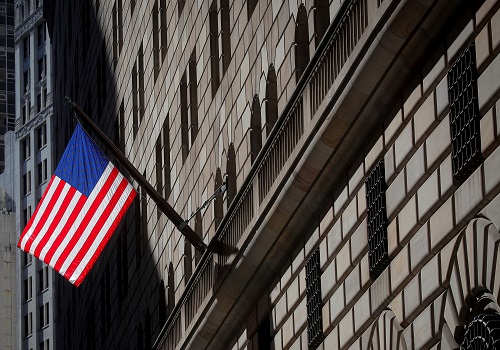
Wall Street Weekahead: High-flying market to take cues from infrastructure plans, upcoming e...

Tag News

MCX Gold June futures technical chart has taken the formation of “Ascending broadening wedge...