The Nifty finally lost 391.5 points or 2.29% to close at 16,677.6 - HDFC Securities

Follow us Now on Telegram ! Get daily 10 - 12 important updates on Business, Finance and Investment. Join our Telegram Channel
Daily Technical View on Nifty
Market: Observation
* Markets corrected further on Wednesday. The Nifty finally lost 391.5 points or 2.29% to close at 16,677.6. Broad market indices like the BSE Mid Cap index lost more, thereby under performing the Sensex/Nifty. Market breadth was negative on the BSE/NSE.
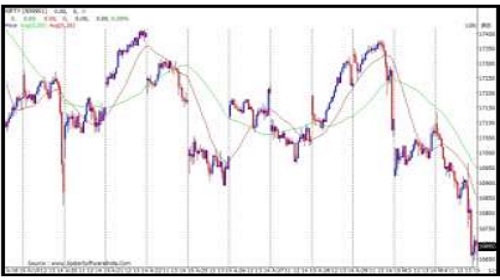
Nifty: 15 min chart indicates breakdown
* Zooming into 15 minute chart, we see that Nifty opened on a shaky note and gradually corrected during the day from the highs. In the process, the index broke down from the 16824-17415 trading range.
* On the 15 min chart, the 20 period MA also continues to trade below the 50 period MA which indicates the negative moving average crossover is still intact. We therefore feel this is a sell on rise market till proved otherwise.
Nifty: Daily chart shows downtrend likely to continue
* Nifty has been trending lower for the last few weeks and making lower tops and lower bottoms in the process. And with yesterday’s breakdown from the 16824-17415 trading range, the downtrend looks set to continue.
*. Any pullback rallies could find resistance at 16824. Our short term bearish view would turn bullish if the Nifty manages to take out the highs of 17133.
* Therefore recommend a go slow approach on fresh longs till we see signs of sustainable strength.
Nifty – 15 min Timeframe chart
To Read Complete Report & Disclaimer Click Here
Please refer disclaimer at https://www.hdfcsec.com/article/disclaimer-1795
SEBI Registration number is INZ000171337
Views express by all participants are for information & academic purpose only. Kindly read disclaimer before referring below views. Click Here For Disclaimer






Top News
ICICI Bank surges on the bourses
Tag News

Nifty registers best week in 2 months after rising for 6 consecutive sessions


More News

Weekly Market Analysis : Marketstraded volatile in the first week of the new financial year ...


