320-x-100_uti_gold.jpg" alt="Advertisement">

The Nifty Bank index witnessed sharp decline to start the week - ICICI Direct

Follow us Now on Telegram ! Get daily 10 - 12 important updates on Business, Finance and Investment. Join our Telegram Channel
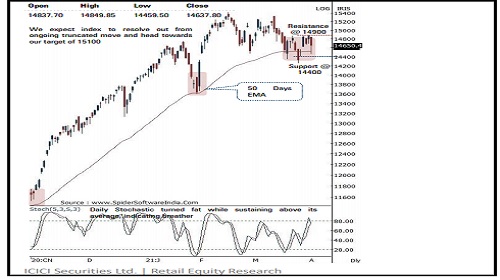
NSE (Nifty): 14638
Technical Outlook
* Equity benchmarks started the week on a subdued note as they pared Thursday’s gains and ended Monday’s session on a negative note. The Nifty settled at 14638, down 230 points or 1.5%. Sectorally, IT, metals outshone while financials and auto underperformed.
* The daily price action formed a bear candle with a sizable lower shadow, indicating extended breather amid stock specific action
* Going ahead, we expect the index to prolong the ongoing consolidation in the broad range of 14900-14400 and form a strong higher base formation that would set the stage for the next leg of up move. Over past ten sessions index has been majorly oscillating in 14900-14400 range.
* The recent observation indicate that declines are getting more time consuming and shallower in nature. The lack of faster retracement on either side signifies extended consolidation. In the process, stock specific action would remain in focus as we expect broader market to regain upward momentum
* Key point to highlight over the past one year, intermediate average correction to the tune of 9% has subsequently produced rally back to lifetime highs. In the current scenario, the index has corrected 7.5%. We expect the market to maintain this rhythm. Hence, buying quality large cap and midcap stocks ahead of the upcoming Q4FY21 result season would be the prudent strategy to adopt from a medium term perspective
* The broader market indices are showing resilience as Nifty midcap and small cap indices are trading well above last week’s low. The formation of higher low signifies elevated buying demand that augurs well for subsequent up move. Currently, both indices are forming a higher base above their 50 days EMA coinciding with upward sloping trend line, which has been held on multiple occasions since June 2020, indicating robust price structure.
* Meanwhile, global broader market indices are approaching their lifetime highs after the recent breather. We expect domestic midcaps to maintain the positive correlation with its global peers and eventually maintain their relative outperformance
* Structurally, rallies have started getting elongated whereas corrections have been shallower, leading to truncated price action. Hence, we believe the Nifty has a strong support base in the vicinity of 14400 as it is 61.8% retracement of post Budget rally (13662-15432), at 14338 In the coming session, the Nifty future is likely to open on a flat note on back of muted Asian cues. We believe, bias would remain corrective after previous session sharp decline. Hence use pullback towards 14740-14765 for creating short position for the target of 14652
NSE Nifty Daily Candlestick Chart
Nifty B a n k: 3267 8
Technical Outlook
* The Nifty Bank index witnessed sharp decline to start the week on a soft note down by 3.5% on Monday. The decline was broad based as all the 12 index constituents closed i n the red . The Nifty Bank closed the session at 3 2678 levels down by 1179 points or 3.5%
* The daily price action formed a sizable bear candle with a lower high -low, as the index contrary to our expectations gave up its entire previous weeks gains and currently tested the testing the major breakout area above the yearly high of CY 2019 & CY 2020 placed around 32500 levels
* Going ahead , the index sustaining above Monday’s low (32330 ) on closing basis will keep pullback option open and will lead to a pullback towards 34000 levels in the coming sessions . Failure to do so will lead to an extended correction
* The support for the index is currently placed at 32600 -32300 levels being the confluence of the following technical observations : a) 61 . 8 % retracement of the previous rally (29687 -37708 ) placed at 32750 levels b) Major breakout area of previous multiple yearly highs placed around 32500 levels c)The rising 100 days SMA is also placed at 32464 levels
* The index has immediate hurdle at 34000 levels as it is the confluence of the previous week high and 50 % retracement of the last leg of decline (36497 -32330 ) .
* The last seven weeks corrective decline has lead to the weekly stochastic placed near the oversold territory with a reading of 21 indicating an impending pullback in the coming weeks . However, the index require to start forming higher high -low in the daily chart on a sustained basis and close above the immediate hurdle of 34000 to signal a resumption of up move
* In the coming session, the index is likely to open on a flat note on back of muted Asian cues . Volatility is likely to remain high . Bias remain corrective after previous session sharp decline . Hence use pullback towards 32930 -32990 for creating short position for the target of 32710 , maintain a stoploss of 33110
Nifty Bank Index – weekly Candlestick Chart

To Read Complete Report & Disclaimer Click Here
https://secure.icicidirect.com/Content/StaticData/Disclaimer.html
Views express by all participants are for information & academic purpose only. Kindly read disclaimer before referring below views. Click Here For Disclaimer


Tag News

Stock Picks : TCS Ltd And Chambal Fertiliser Ltd By ICICI Direct


More News

Global cues and earnings season will continue to induce volatility - Religare Broking