Stock Idea - Bank of India Ltd By Choice Broking

Follow us Now on Telegram ! Get daily 10 - 12 important updates on Business, Finance and Investment. Join our Telegram Channel
Bank of India
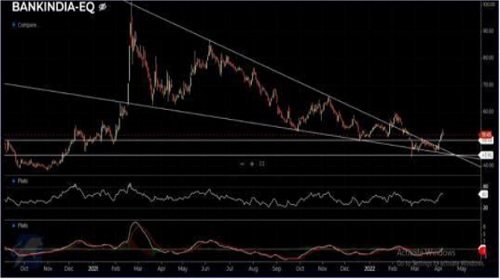
On the weekly chart, the stock has confirmed the consolidation breakout and has sustained above the price of 50. On the monthly chart, it has formed a Bullish Engultin, confirming bullishness in the stock. Moreover, itis also for formation on the monthly chart
On the daily chart, stock is tradin wesimple moving averages of 20 and 50 respectively confirming the support in price action. The price has traded above Ichimoku Cloud & positive crossover is indicated in RSI MACD in momentum indicator as well that sug near term,
Ona daily scale, the price has been trading upward consecutively from the last five trading volume activity, which points out buying interest among the trades
chart, along with the support of the Double Bottom pattern. on the daily Hence, based on the above technical structure one can initiate a long position in BANKINDIA at CMP 52.3 or a fall in the prices till 50 levels, can be used as buying opportunity for the upside target of 60-65 while the support is placed at around 47 and 45.50 levels. Solevel 45.50, should be considered as stop loss ona closing’
To Read Complete Report & Disclaimer Click Here
Please refer disclaimer at https://choicebroking.in/disclaimer
Above views are of the author and not of the website kindly read disclaimer