On the daily scale the smart recovery from the expected support zone of 17450 - Tradebulls Securities

Follow us Now on Telegram ! Get daily 10 - 12 important updates on Business, Finance and Investment. Join our Telegram Channel
Nifty
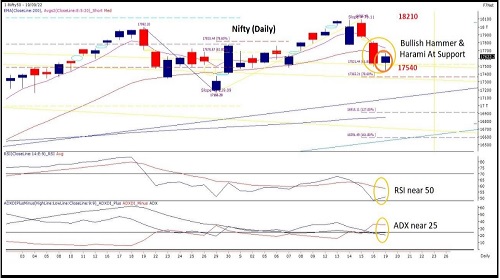
On the daily scale the smart recovery from the expected support zone of 17450 ensured that the ongoing 17540 closing-basedsupportzone remained valid. The recovery from the early morning losses eventually resulted into a dual combination of candlestickreversal formations viz. the ‘Bullish Hammer’ & also a prominent ‘Bullish Harami’. Occurrence of these patterns is a strong sign of afollowthrough move in a day or so which would help the index to surface back above its 5 & 20 DEMA zone resistance levels. Thepriorwavesintensity of the decline remains critical as index breached & engulfed its 6 days price action within 1.5 days itself sending jittersinthemind of investors & traders. Hence the recovery also should be significant in case the index needs to re-counter the movetowards18100. On the oscillator front both its trend strength indicators are placed around their respective make or break zones withRSI hovering at 50 & ADX at 25 which still support the ongoing price action trend to remain firm on the bullish side. As per theweeklydataset it looks like a ranged price action within 17800-17400 zone traders should refrain from building aggressive positions oneitherduringthe week & wait for more clarity to emerge post this weekly close. An early close above 17800 could evoke the upside movetowards18210 only while a sustained closing below 17300 could push the index towards 17000.

To Read Complete Report & Disclaimer Click Here
Please refer disclaimer at https://www.tradebulls.in/disclaimer
SEBI Registration number is INZ000171838
Views express by all participants are for information & academic purpose only. Kindly read disclaimer before referring below views. Click Here For Disclaimer


Tag News

Weekly Market Analysis : Markets strengthened recovery and gained nearly 2% in the passing w...


More News

The chart pattern suggests that if Nifty breaks and sustains below 19500 level - Jainam Shar...


