Nifty started the week on a positive note but witnessed selling at higher levels to end the week on weak note - Axis Securities

Follow us Now on Telegram ! Get daily 10 - 12 important updates on Business, Finance and Investment. Join our Telegram Channel
Nifty
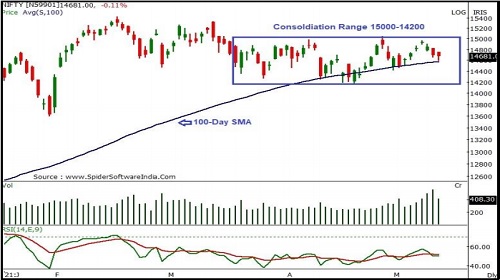
Nifty started the week on a positive note but witnessed selling at higher levels to end the week on weak note. Nifty closed at 14678 with a loss of 145 points on a weekly basis.
On the weekly chart index has formed a bearish candle but has bounced from an important support making a long lower wick indicating positive bias. Since past 8-9 weeks, the index is consolidating within broad range of 15000- 14200 levels representing short term sideways trend. The chart pattern suggests that if Nifty crosses and sustains above 14800 level it would witness buying which would lead the index towards 15000-15250 levels. Important Support for the week is around 14400-14200. Nifty is now well placed above its 100 SMA indicating positive bias in the short term. Nifty continues to remain in an uptrend in the medium term, so buying on dips continues to be our preferred strategy. For the week, we expect Nifty to trade in the range of 15000-14400 with mixed bias.
The weekly strength indicator RSI is moving downwards and is quoting below its reference line indicating negative bias. However momentum oscillator Stochastic has turned positive from the oversold zone indicating a possible consolidation or a up-move in the near term
Banknifty
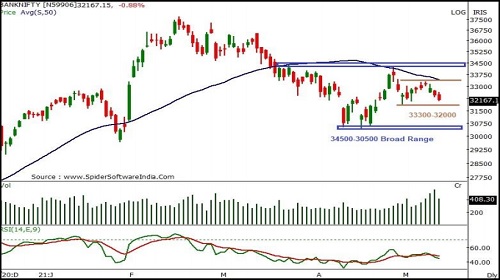
Bank Nifty started the week on a flat note and remained negative throughout the week. Bank Nifty closed at 32170 with a loss of 735 points on a weekly basis.
On the weekly chart index has formed a bearish candle and has remained restricted within previous week's HighLow range which signals indecision at current levels. Since past couple of weeks, index is consolidating within 34000-31800 levels indicating short term consolidation. Hence any either side breakouts will indicate further direction. The chart pattern suggests that if Bank Nifty crosses and sustains above 33000 level it would witness buying which would lead the index towards 33500-34500 levels. However if index breaks below 31900 level it would witness selling which would take the index towards 31500-30700. Bank Nifty is trading below 20, 50, and 100 day SMA's which are important short term moving averages, indicating negative bias in the short to medium term. Bank Nifty continues to remain in an uptrend in the medium term, so buying on dips continues to be our preferred strategy. For the week, we expect Bank Nifty to trade in the range of 33500-31500 with mixed bias.
The weekly strength indicator RSI is moving downwards and is quoting below its reference line indicating negative bias. However momentum oscillator Stochastic has turned positive from the oversold zone indicating a possible consolidation or a up-move in the near term.
The trend deciding level for the day is 32305 If BANKNIFTY trades above this level then we may witness a further rally up to 32490-32810-32995 levels. However, if BANKNIFTY trades below 32305 levels then we may see some profit booking initiating in the market, it may correct up to 31980-31795-31475 levels
To Read Complete Report & Disclaimer Click Here
For More Axis Securities Disclaimer https://simplehai.axisdirect.in/disclaimer-home
SEBI Registration number is INZ000161633
Views express by all participants are for information & academic purpose only. Kindly read disclaimer before referring below views. Click Here For Disclaimer


More News

Daily Market Analysis : The Market kicked off the week on a positive note, gaining over half...