Nifty small cap index scaled to fresh 52 weeks high - ICICI Direct

Follow us Now on Telegram ! Get daily 10 - 12 important updates on Business, Finance and Investment. Join our Telegram Channel
NSE(Nifty): 15030
Technical Outlook
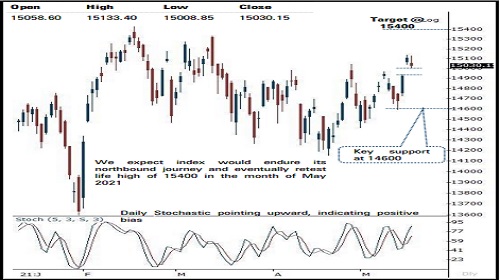
* Wednesday’s lacklustre session formed a small bear candle with sizable upper shadow, highlighting breather after past two sessions (~550 points) sharp up move. In the process, stock specific action prevailed as Nifty small cap index scaled to fresh 52 weeks high
* Going ahead, we reiterate our constructive stance on the market and expect Nifty to head towards 15400 in the month of May 2021. Key point to highlight is that, despite minor profit booking in the benchmark, broader market indices endured their relative outperformance supported by strong market breadth, indicating inherent strength that augurs well for durability of ongoing up trend
* We believe, a breather after faster pace of retracement (on the smaller degree chart) signifies healthy retracement that would set the stage for next leg of up move. Therefore, extended breather from hereon should be used as incremental buying opportunity in quality large cap and mid caps amid progression of Q4FY21 earnings
* In line with our view, Nifty small cap index maintained its relative outperformance by extending gains over third consecutive session and clocked a fresh 52 weeks high. We expect, broader market to accelerate their relative outperformance wherein catch up activity would continued to be seen in small cap index, as Nifty midcap index is hovering around all time high whereas small cap index is still 6% away from life highs
* Structurally, the formation of higher base signifies elevated buying demand that makes us confident to retain support base upward at 14600 as it is confluence of:
* a) 61.8% retracement of current up move (14151-15137), at 14530
* b) last week’s low is placed at 14592
* In the expiry induced volatile session, we expect stock specific action would remain in focus amid positive bias. Hence, use intraday dip towards 14985-15010 to create long for target of 15098.
NSE Nifty Daily Candlestick Chart
Nifty Bank: 33685
Technical Outlook
* The daily price action formed a second consecutive high wave candle after Monday’s strong up move signalling consolidation and higher base formation for the next leg of up move
* Key observation is that the index during current week has registered a breakout above a falling supply line joining major highs of the last three months highlighting resumption of the up move . We expect the index to head towards our medium term target of 34900 levels in the coming weeks as it is the 61 . 8 % retracement of the entire recent decline (37708 -30405 )
* The index has immediate support at 32000 levels being the confluence of the last two weeks low and the 61 . 8 % retracement of the previous up move (30405 -34287 )
* The index in the last two weeks has formed a higher base above the 61 . 8 % retracement of the preceding two weeks up move (30405 -34287 ) . A shallow retracement highlights higher base formation and a positive price structure
* The index has maintained the rhythm of not correcting more than 20 % as witnessed since March 2020 . In the current scenario, it rebounded after correcting 19 % from the all -time high (37708 ) . Hence it provides favourable risk -reward setup for the next leg of up move
* In the coming session, the index is likely to open on a flat note amid muted global cues . Volatility is likely to be high owing to the weekly expiry . We expect the index to sustain above Tuesday gap up area (33605 -33801 ) and trade with positive bias . Hence use dips towards 33520 -33580 for creating long position for the target of 33820 , maintain a stoploss of 33410
* Among the oscillators, the daily stochastic remain in uptrend and is seen sustaining above its three periods average thus supports the positive bias in the index in the coming sessions
Nifty Bank Index – Daily Candlestick Chart

To Read Complete Report & Disclaimer Click Here
https://secure.icicidirect.com/Content/StaticData/Disclaimer.html
Views express by all participants are for information & academic purpose only. Kindly read disclaimer before referring below views. Click Here For Disclaimer


Tag News

Stock Picks : TCS Ltd And Chambal Fertiliser Ltd By ICICI Direct