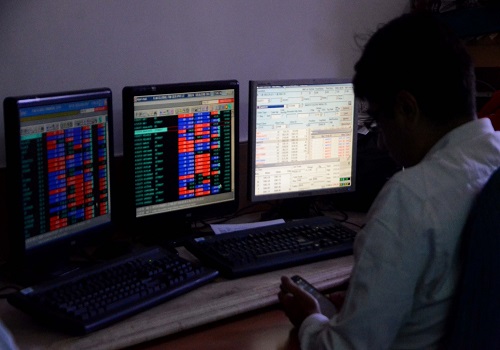
Nifty opened on a flat note and witnessed extreme volatility on either side for most part of the session - Axis Securities

Follow us Now on Telegram ! Get daily 10 - 12 important updates on Business, Finance and Investment. Join our Telegram Channel
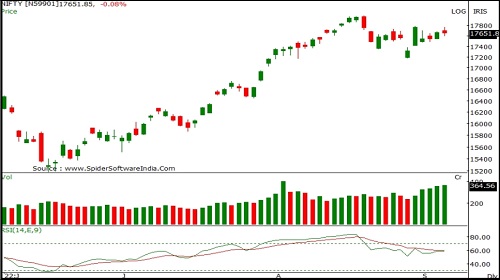
Nifty
Nifty opened on a flat note and witnessed extreme volatility on either side for most part of the session. Nifty closed at 17656 with a loss of 10 points.
On the daily chart the index has formed a small bearish candle with either side shadows representing volatility movement throughout the session. The index is moving in a Higher Top and Higher Bottom formation on the daily chart indicating an up trend. The chart pattern suggests that if Nifty crosses and sustains above 17700 level it would witness buying which would lead the index towards 17800-17900 levels. However if the index breaks below 17600 level it would witness selling which would take the index towards 17500-17400. Nifty is trading above its 20, 50 , 100 and 200 day SMA which indicates positive bias in the short term. Nifty continues to remain in an uptrend for the short term, so buying on dips continues to be our preferred strategy
The daily strength indicator RSI is moving downwards and is quoting below its reference line indicating negative bias.
The trend deciding level for the day is 17670. If NIFTY trades above this level then we may witness a further rally up to 17750-17845-17930 levels. However, if NIFTY trades below 17670 levels then we may see some profit booking initiating in the market, which may correct up to 17575-17490-17395 levels.
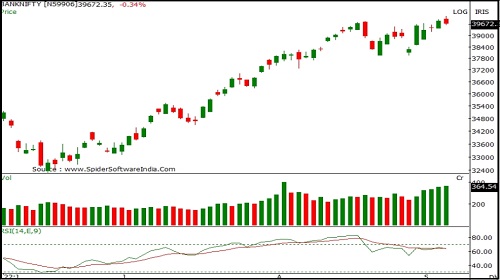
Banknifty
Banknifty opened on a flat note and witnessed extreme volatility on either side for most part of the session. Banknifty closed at 39667 with a loss of 139 points.
On the daily chart the index has formed a bearish candle with either side long shadows indicating extreme volatility at higher levels. The index is moving in a Higher Top and Higher Bottom formation on the daily chart indicating a short term up trend. The chart pattern suggests that if Banknifty crosses and sustains above 39800 level it would witness buying which would lead the index towards 40200-40500 levels. However if the index breaks below 39600 level it would witness selling which would take the index towards 39400-39200. Banknifty is trading above 20, 50 , 100 and 200 day SMA indicating positive bias in the short to medium term. Banknifty continues to remain in an uptrend in the short term, so buying on dips continues to be our preferred strategy.
The daily strength indicator RSI continues to remain flat and is below its reference line indicating absence of momentum on either side.
The trend deciding level for the day is 39770. If BANK NIFTY trades above this level then we may witness a further rally up to 39970-40280-40480 levels. However, if BANK NIFTY trades below 39770 levels then we may see some profit booking initiating in the market, which may correct up to 39465-39260-38955 levels.
To Read Complete Report & Disclaimer Click Here
For More Axis Securities Disclaimer https://simplehai.axisdirect.in/disclaimer-home
SEBI Registration number is INZ000161633
Views express by all participants are for information & academic purpose only. Kindly read disclaimer before referring below views. Click Here For Disclaimer


More News

Rollover Analysis –July 21 : Two consecutive series of consolidation for Nifty by YES Securi...