
 320-x-100_uti_gold.jpg" alt="Advertisement">

Nifty continues to remain in an uptrend in the medium and long term - Axis Securities

Follow us Now on Telegram ! Get daily 10 - 12 important updates on Business, Finance and Investment. Join our Telegram Channel
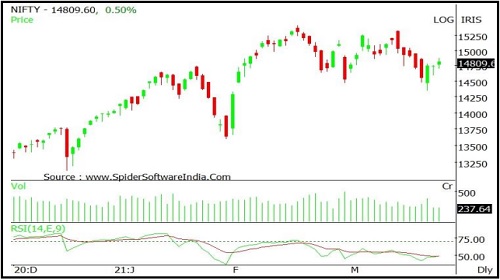
Nifty
Nifty opened with an upward gap and formed shadows on either side indicating lack of bullish confidence amongst participants. Nifty closed at 14815 with a gain of 78 points.
On the daily chart the index has formed a small bullish candle with shadows on either side representing extreme volatility as well as indecisiveness amongst participants regarding the direction. The index continues to move in a Higher Top and Higher Bottom formation on the hourly chart indicating positive bias.
The chart pattern suggests that if Nifty breaks and sustains below 14700 level it would witness selling which would lead the index towards 14500-14400 levels. Important Resistances for the day are placed at 15000-15100. Nifty is trading below 20 day SMA indicating negative bias in the short to medium term.
Nifty continues to remain in an uptrend in the medium and long term, so buying on dips continues to be our preferred strategy. The daily strength indicator RSI has turned positive from the oversold territory and is above its reference line indicating sustained uptrend.
The trend deciding level for the day is 14800. If NIFTY trades above this level then we may witness a further rally up to 14895-14970-15065 levels. However, if NIFTY trades below 14800 levels then we may see some profit booking initiating in the market, which may correct up to 14720-14630-14550 levels
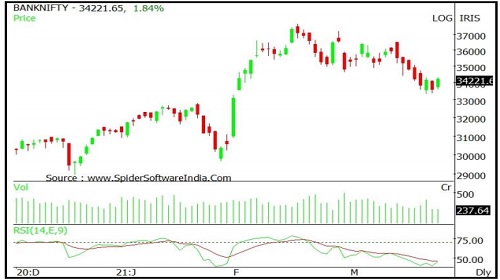
Bank Nifty
Banknifty opened with an upward gap and remained in positive terrain throughout the day. Banknifty closed at 34184 with a gain of 581 points.
On the daily chart index has formed a bullish candle and has closed above previous session's close indicating signs of short-covering.. The index continues to move in a Higher Top and Higher Bottom formation on the hourly chart indicating positive bias.
The chart pattern suggests that if Banknifty crosses and sustains above 34300 level it would witness buying which would lead the index towards 34700-35000 levels. However if index breaks below 34000 level it would witness selling which would take the index towards 33700-33300. Banknifty is trading below 20 day SMA indicating negative bias in the short to medium term.
Banknifty continues to remain in an uptrend in the medium and long term, so buying on dips continues to be our preferred strategy. The daily strength indicator RSI is moving downwards and is quoting below its reference line indicating negative bias. The trend deciding level for the day is 34055.
If BANK NIFTY trades above this level then we may witness a further rally up to 34490-34795-35225 levels. However, if BANK NIFTY trades below 34055 levels then we may see some profit booking initiating in the market, which may correct up to 33750-33315-33015 levels
To Read Complete Report & Disclaimer Click Here
For More Axis Securities Disclaimer https://simplehai.axisdirect.in/disclaimer-home
SEBI Registration number is INZ000161633
Views express by all participants are for information & academic purpose only. Kindly read disclaimer before referring below views. Click Here For Disclaimer


More News

Benchmark index is likely to trade with mild positive bias with support at 17150 - 17050 lev...


