Nifty closed at 15173 with a gain of 67 points - Axis Securities

Follow us Now on Telegram ! Get daily 10 - 12 important updates on Business, Finance and Investment. Join our Telegram Channel
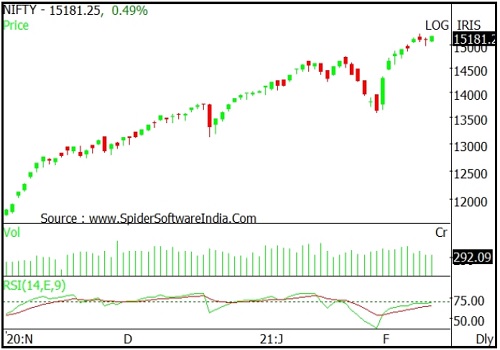
Nifty
Nifty opened on a flat note but buying led the index upwards to end in the green. Nifty closed at 15173 with a gain of 67 points. On the daily chart index has formed a bullish candle forming higher High-low compared to the previous session and has also closed above previous session’s high indicating sustained strength. The index continues to move in a Higher Top and Higher Bottom formation on the hourly chart indicating positive bias.
The chart pattern suggests that if Nifty breaks and sustains above 15200 levels then index may scale towards 15300-15400 levels. On the downside, an immediate intraday support is placed around 15000 level and any voialtion of this support zone may cause profit booking which would take the index towards 14800-14700 levels.
Nifty is trading above its 20 day SMA which indicates positive bias in the short term. Nifty continues to remain in an uptrend in the medium and long term, so buying on dips continues to be our preferred strategy. The daily strength indicator RSI has turned positive from the oversold territory and is above its reference line indicating sustained uptrend.
The trend deciding level for the day is 15140. If NIFTY trades above this level then we may witness a further rally up to 15220-15265-15345 levels. However, if NIFTY trades below 15140 levels then we may see some profit booking initiating in the market, which may correct up to 15095-15020-14975 levels
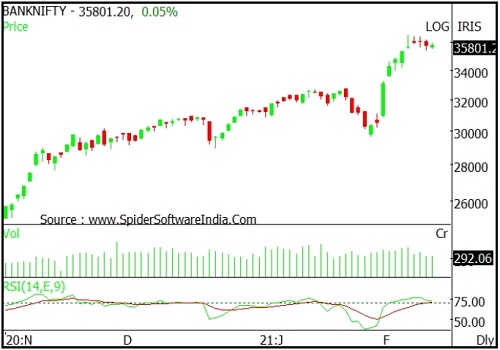
Banknifty
Banknifty opened on a flat note and remained in a small range throughout the day. Banknifty closed at 35752 with a loss of 31 points. On the daily chart index has formed a bullish candle however it remained restricted within previous session's HighLow range indicating absence of strength on eitherside. The index continues to move in a Higher Top and Higher Bottom formation on the hourly chart indicating positive bias.
The chart pattern suggests that if Banknifty crosses and sustains above 36200 level it would witness buying which would lead the index towards 36600-36900 levels. However if index breaks below 35600 level it would witness selling which would take the index towards 35400- 35000. Banknifty is trading above 20 and 50 day SMA's indicating positive bias in the short to medium term.
Banknifty continues to remain in an uptrend in the medium and long term, so buying on dips continues to be our preferred strategy. The daily strength indicator RSI has turned positive from the oversold territory and is above its reference line indicating sustained uptrend. The trend deciding level for the day is 35780.
If BANK NIFTY trades above this level then we may witness a further rally up to 35985-36215-36420 levels. However, if BANK NIFTY trades below 35780 levels then we may see some profit booking initiating in the market, which may correct up to 35545-35340-35110 levels.
To Read Complete Report & Disclaimer Click Here
For More Axis Securities Disclaimer https://simplehai.axisdirect.in/disclaimer-home
SEBI Registration number is INZ000161633
Views express by all participants are for information & academic purpose only. Kindly read disclaimer before referring below views. Click Here For Disclaimer


More News

Nifty crosses and sustains above 17150 level - Jainam Share Consultants