Listed Realty Players` Sales Share Increased to 22% in 1st 9 Months of FY21, from 6% in FY17 By ANAROCK Property Consultants

Follow us Now on Telegram ! Get daily 10 - 12 important updates on Business, Finance and Investment. Join our Telegram Channel
Listed Realty Players’ Sales Share Increased to 22% in 1st 9 Months of FY21, from 6% in FY17
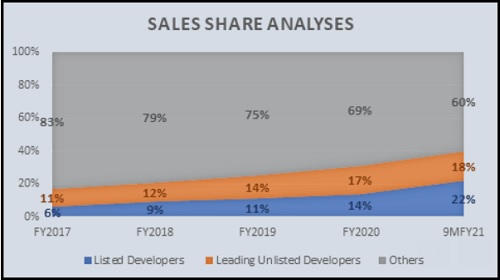
* Of total 93,140 units sold in first 3 quarters of FY21 (Apr-Dec 2020), top 8 listed players comprised a 22% share; leading unlisted players had 18% & others (non-branded) a 60% share
* FY17, of total 2.03 lakh units sold, listed players’ share was just 6%; leading unlisted players had a 11% share while others had a massive 83% share
* Despite COVID-19 pandemic, top 8 listed players sold approx. 21.23 mn sq. ft. in first 3 quarters of FY 2021 - 2% more than in the corresponding period of FY 2020
* Godrej Properties sold highest area – approx. 6.64 mn sq. ft., followed by Bengaluru-based Prestige Estates with 5.04 mn. sq. ft.
* Trends clearly indicate growing dominance of listed & leading unlisted players in Indian residential market
Mumbai, 24 May 2021: The overall housing sales share of the top 8 listed realty players is increasing inexorably y-o-y. As per latest ANAROCK data, of the total sales made in the first nine months of FY2021 (approx. 93,140 units) across the top 7 cities, the top 8 listed players’ share stood at 22% while non-listed leading players’ share was 18%. Non-branded developers accounted for a 60% share.
In contrast, of the total 2.03 lakh units sold in top 7 cities in FY2017, the share of these top 8 listed players was the lowest at about 6% while that of non-listed leading players stood at 11% and others (non-branded) had a whopping 83% share.
The increased share of these top 8 listed players over the years provides a clear roadmap of homebuyers’ evolving preferences.
The top 8 listed developers considered are Brigade Enterprises, Godrej Properties, Kolte-Patil, Mahindra Lifespaces, Oberoi Realty, Prestige Estates, Puravankara, and Sobha.
If we consider total sales area data of these players as per their company presentations, they together sold as much as 21.23 mn sq. ft. area in the first three quarters of financial year 2021 (Apr-Dec. 2020 period) despite the first wave of COVID-19 – rising by 2% against the corresponding period in FY2020, when 20.88 mn sq. ft. were sold.
Among the listed players, Godrej Properties sold the maximum in terms of area (approx. 6.64 mn sq. ft.) in this period, followed by Bengaluru-based Prestige Estates with approx. 5.04 mn. sq. ft. space.
Anuj Puri, Chairman – ANAROCK Property Consultants says, “After the roll-out of structural policies including RERA and GST, organized and branded players’ dominance has risen exponentially. Homebuyer demand has tilted towards branded products. Both listed and leading developers have been catering to this new demand with projects for the affordable and mid-income segments, rather than playing only to the luxury homes gallery. This demand-supply equilibrium has helped keep sales momentum going during the pandemic, when housing demand rose significantly.”
“The top 8 listed players’ sales share increased to 22% from April to December 2020 – a major increase from 6% in FY 2017. Even non-listed leading developers have ramped up their share from 11% in FY 2017 to 18% now. It is a major and ongoing realignment in residential real estate demand and supply.”
Top leading developers considered include Aparna Constructions and Estates, Assetz Property, ATS Green, Casagrand Builders, Kalpataru, Lodha Group, My Home Constructions, Piramal Realty, Runwal Group, Salarpuria Sattva, Shriram Properties, Signature Global, Sunteck Realty, TATA Housing Development Co., The Shapoorji Pallonji Group, The Wadhwa Group, VTP Realty and Lodha Group (now known as Macrotech Developers Ltd. which was listed in April 2021).
Listed Developers’ Sales Trend
The top 8 listed players collectively sold approx. 21.23 mn sq. ft. of residential space in the first nine months of FY21. Complete data for the fourth quarter FY2021 is still awaited. Breaking down the data on a quarterly basis reveals that Q3 FY21 (the Oct.-Dec. period) was one of the best-ever quarters for these listed players with total area sold increasing by 77% against the preceding quarter (Q2 FY21 - Jul-Sept).
* Q1 FY21 (Apr.– Jun.) - the most heavily impacted by the COVID-19-induced national lockdown - saw approx. 5.16 mn sq. ft. sold by the top 8 listed realty players.
* Q2 FY 21 (Jul-Sept) saw only a meagre increase despite easing of lockdown restrictions - approx. 5.8 mn sq. ft. area was sold during the quarter. This was also because the inauspicious ‘shraad’ period in this quarter causes many buyers to steer clear of property purchases
* The festive quarter of Q3 FY21 saw a 77% rise in area sold, against the preceding quarter when approx. 10.27 mn sq. ft. area was cumulatively sold by these top 8 listed players.
* In Q4 FY21, only three listed players - Brigade Enterprises, Oberoi Realty and Mahindra Lifespaces Developers - had released their data; according to this, they had collectively sold approx. 3.21 mn sq. ft. in this quarter. The data of the remaining five players is still awaited.
Above views are of the author and not of the website kindly read disclaimer









 320-x-100_uti_gold.jpg" alt="Advertisement">


