Indian markets could open lower, following negative Asian markets and lower US markets on Thursday - HDFC Securities

Follow us Now on Telegram ! Get daily 10 - 12 important updates on Business, Finance and Investment. Join our Telegram Channel
Indian markets could open lower, following negative Asian markets and lower US markets on Thursday - HDFC Securities
US stocks finished sharply lower Thursday as another jump in U.S. Treasury yields reflected expectations for faster economic recovery and inflation, fueling more rotation into sectors likely to benefit from the reopening, rather than technology stocks that benefited from last year’s work-from-home trend. Meanwhile, energy sector stocks also slumped as crude oil futures fell 7% (the retreat wiped out four weeks of gains in a single session and might mark the end of a five-month bull run), suffering the biggest one day loss since September as some European countries battle a third wave of the coronavirus pandemic and a slow vaccine rollout, implying less travel and lower energy demand this summer.
Initial claims for the week came in at 770,000, higher than the expected 700,000 and worse than last week’s reading of 712,000. The Philadelphia Fed’s March manufacturing index unexpectedly jumped to 51.8 from a reading of 23.1 in February.
The 10-year Treasury note yield was up nearly 10 basis points to around 1.74%, around its highest level since January 2020. Meanwhile, the 30-year bond yield was knocking on the door of 2.5%, near its loftiest level since mid-2019. One of the most important factors is that the real yield—the yield minus expected inflation—on the 10-year Treasury note is negative 0.6%. That means it loses value against inflation, so investors are likely to keep selling it, lowering the price and lifting the yield.
The BOJ’s has taken measures would allow the 10-year Japanese government bond yield to move in a range between 0.25% and negative 0.25%, compared with the current range of 0.20% and negative 0.20%. This tweak would allow further back-end steepening of the [Japanese government bond] curve, alleviating some of the pressure on financial institutions, and making the BoJ’s easing program more sustainable in the long run. As an anchor of bond yields across the world, rising rates in Japan can be amplified into broader weakness in Europe and U.S. bonds as Japanese investors reassess the gains from holding domestic debt over their overseas peers.
Turkey’s central bank raised interest rates by 200 bps and Brazil’s central bank raised rates by 75 bps (and said it will probably do so again in May).
Asian share markets eased on Friday as a spike in global bond yields soured sentiment toward richly priced tech stocks, while a stampede out of crowded positions in crude oil caused the sharpest setback in months.
Indian benchmark equity indices ended lower in the fifth straight session on March 18. At close, the Nifty was down 163.40 points or 1.11% at 14,557.90. Highest spike to new Covid-19 cases in the past 102 days, rise in U.S. bond yields and weekly options related volatility kept sentiment risk-off.
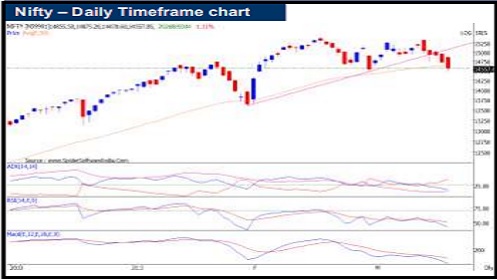
Daily Technical View on Nifty
Nifty Breaches 50 Days EMA Support
Nifty fell for the fifth consecutive session, to close at 14721. This is the lowest close since 26th Feb 2021 for Nifty. Nifty and BankNifty violated the crucial support of its 50 days EMA Daily ADX value has risen for the second consecutive day with indices maintaining their down trend.
This indicates that momentum is back In to the markets and prevailing price trend could see follow up selling.
Short Term Market trend has been bearish and rising ADX value along with the price fall indicates the chances of momentum selling in the Index RSI and MACD indicators have been moving down with negative crossovers.
8 days EMA has shown negative crossover on 13 and 21 days EMA on Nifty, BankNifty and Fin Nifty Charts There is an upside unfilled gap between 14336 and 14469. This range could act a immediate support. Failing to sustain above this support would be considered bearish breakdown on medium term Nifty charts Resistance for the Nifty is seen at 14875.
To Read Complete Report & Disclaimer Click Here
Please refer disclaimer at https://www.hdfcsec.com/article/disclaimer-1795
SEBI Registration number is INZ000171337
Views express by all participants are for information & academic purpose only. Kindly read disclaimer before referring below views. Click Here For Disclaimer


Tag News

Nifty registers best week in 2 months after rising for 6 consecutive sessions