Indian markets could open flat to mildly lower, in line with largely flat Asian markets today and mixed US markets on Monday - HDFC Securities

Follow us Now on Telegram ! Get daily 10 - 12 important updates on Business, Finance and Investment. Join our Telegram Channel
Indian markets could open flat to mildly lower, in line with largely flat Asian markets today and mixed US markets on Monday - HDFC Securities
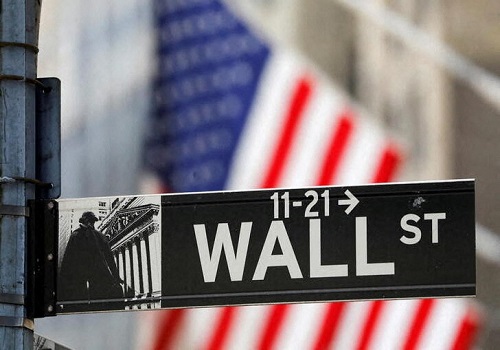
US stocks fell Monday, losing some steam after rising to all-time highs late last week. Commodity prices tumbled as concerns over the coronavirus's spread resurged, with crude oil prices moving sharply to the downside but rising U.S. Treasury yields lifted financial stocks, keeping Wall Street's benchmark index near record levels. The spread of the delta coronavirus variant, profittaking and a downgrade of China growth by Goldman Sachs dinged bullish sentiment on Wall Street.
China reported more COVID-19 infections, while U.S. cases and hospitalizations were at a six-month high as the Delta variant spread
Inflows into Indian equity funds climbed to at least a two-year high in July at Rs.22584 cr. Contributions to systematic investment plans rose for the fourth straight month to an all-time high in July at Rs.9609 cr. More than 23 lakh SIP accounts opened during the month, also a record.
Asian stocks started off on a weak footing on Tuesday after a largely soft performance on Wall Street and persistent concerns over the spread of the Delta variant of the coronavirus dented sentiment and triggered falls in metals and oil prices.
Nifty after opening mildly higher on Aug 09, soon gave up morning gains. It formed an intra day low at 1345 Hrs post which a decent recovery ensued. At close the Nifty was up 0.12% or 20 points at 16258. Volumes on the NSE were the lowest since July 14.
Stock specific moves are visible as the Q1 results announcement continues. BSE MidCap shed over 1% while the BSE SmallCap declined nearly 0.75%. Advance decline ratio continued to be deeply in the negative on Aug 09. This reflects profit taking across the board by traders/investors. The Nifty has made a lower low and lower high on a near term basis. However as long as 16146 is not breached, a larger correction may not begin.
Daily Technical View on Nifty
Observation: Markets ended with marginal gains on Monday after witnessing a roller coaster ride. The Nifty finally gained 20.05 points or 0.12% to close at 16,258.25.
Broad market indices like the BSE Mid Cap and Small Cap indices ended lower, thereby under performing the Sensex/Nifty. Market breadth was negative on the BSE/NSE.
Zooming into the 60 minute chart, we can see that the Nifty opened on a positive note but selling pressure soon emerged and pushed the index lower into negative territory. The index broke the 16210 supports in the process. But a recovery in the last one hour of trade helped the index to close with marginal gains.
Looking at the 60 min chart, it seems the index is now in consolidation mode after the breakout seen last week. The Nifty needs to cross the highs of 16321 for the bulls to come back in control. Else, it could drift lower towards the 16105 supports.
On the daily chart, the Nifty continues to hold above a rising trend line that has held the important lows of the last few months. This implies that the index remains in an intermediate uptrend. The index also continues to trade above the 20 and 50 day SMA, which gives further evidence of an uptrend.
And last week, Nifty has broken out of the 15451-15962 trading range, which is an encouraging signal for the uptrend to continue. Upside target implications are at 16500. Crucial supports to watch for a short term trend reversal are at 16105.+
Conclusion: The 1-2 day trend of the Nifty is now down with the Nifty breaking its nearby supports and making lower tops over the last few sessions. Nifty could test the 16105 levels in the very near term. On the larger daily timeframe, Nifty has broken out of the 15451-15962 trading range and also trades above the 20 and 50 day SMA, which gives further evidence of the uptrend to continue towards the 16500 levels. Short term trend reversal levels are at 16105.
Nifty – Daily Timeframe chart

To Read Complete Report & Disclaimer Click Here
Please refer disclaimer at https://www.hdfcsec.com/article/disclaimer-1795
SEBI Registration number is INZ000171337
Views express by all participants are for information & academic purpose only. Kindly read disclaimer before referring below views. Click Here For Disclaimer




Top News

Hyundai Motor India announces 'Save Water Challenge' for customers on World Environment Day
Tag News

Nifty registers best week in 2 months after rising for 6 consecutive sessions


More News

Nifty has an immediate support placed at 19530 and on a decisive close below expect a fall t...

