320-x-100_uti_gold.jpg" alt="Advertisement">

Index is likely to open on a flat note tracking muted global cues - ICICI Direct

Follow us Now on Telegram ! Get daily 10 - 12 important updates on Business, Finance and Investment. Join our Telegram Channel
Nifty: 15639
Technical Outlook
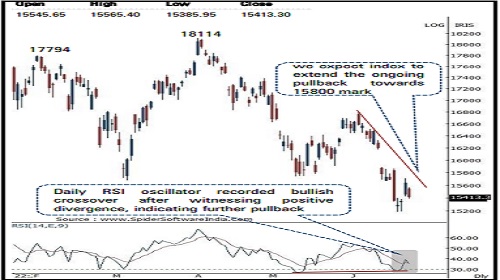
* The index started the session on a subdued note and gradually inched southward as intraday pullbacks were short lived. Daily price action formed a bear candle carrying lower high-low, indicating corrective bias as the index failed to capitalise on past two session’s pullback. In the process, it retraced 61.8% of past two session’s up move
* Going ahead, the index needs to decisively close above 15800 along with improving market breadth that will confirm end of corrective phase and open the door for extended pullback in coming sessions. Failure to do so would lead index to undergo consolidation in 15800- 15200 range amid stock specific action. On upsides, level of 15800 will be the key monitorable as it is confluence of: a) downward slanting trend line drawn adjoining subsequent highs of June (16794-16493), around 15800 b) 38.2% retracement of June decline (16794-15183) c) lower band of negative gap recorded on June 13 (16201-15878)
* On the contrary, immediate support for the Nifty is placed at last week’s low of 15200. However, the breach of 15200 (on a closing basis) would lead to extended correction towards major support zone of 14800-14600 which we expect to hold amid oversold condition as it is confluence of: A) 80% retracement of CY-21 rally (13596-18604), at 14600 B) implicated target of recent consolidation breakdown 16800- 15700, is placed at 14600
* Structurally, the sentiment indicators are approaching their bearish extremes. Historically, reading of percentage of stock above 200 DMA below 15 signifies extreme pessimism in the markets that eventually leads to a technical pullback in subsequent weeks. Currently index recorded bearish extreme of 12 (which is lowest since March 2020) suggesting possibility of a technical pullback in following weeks
* On the broader market front, in three instances over past decade, maximum bull market correction in the Nifty Midcap, Small cap indices have been to the tune of 28% and 38%, respectively. In current scenario both indices have corrected 25% and 34%, respectively. Thus possibility of 3-4% correction from hereon cannot be ruled out amid oversold territory which would set the stage for a technical pullback in coming weeks
* In the coming session, index is likely to open on a flat note tracking muted global cues. We expect volatility to remain high owing to weekly expiry. Hence, use intraday dip towards 15304-15332 for creating long position for the target of 15419.
NSE Nifty Daily Candlestick Chart
Nifty Bank: 32845
Technical Outlook
* The daily price action formed a bear candle with a lower high -low signaling lack of follow through to previous session pullback and continuation of the overall corrective bias . The index in the process closed below the 33000 levels on Wednesday
* Going ahead, a follow through weakness below Wednesday low (32758 ) will signal continuation of the decline towards March low of 32155 in the coming sessions .
* The Index need to start forming higher high -low in the daily chart on a sustained basis for any meaningful technical pullback to materialize
* Bank Nifty has immediate hurdle at 33800 levels being the confluence of the lower band of the last Monday’s gap down area (33774 -34345 ) and the 38 . 2 % retracement of the last three weeks decline (36083 -32291 )
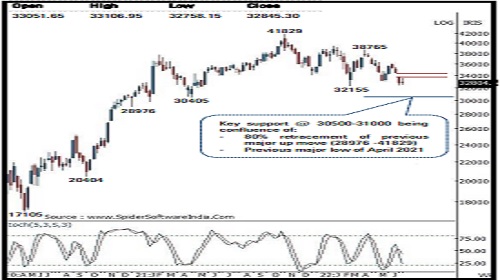
* The index has major support around 30500 -31000 levels being the confluence of the following technical observations :
* (a) 80 % retracement of the previous major rally of December 2020 -October 2021 (28976 -41829 )
* (b) previous major low of April 2021 is also placed at 30405
In the coming session, index is likely to open on a soft note amid muted global cues . We expect the index to trade with positive bias while holding above 80 % retracement of recent up move around 32500 . Hence use intraday dips towards 32600 -32680 for creating long position for the target of 32930 , maintain a stoploss at 32490
Nifty Bank Index – Weekly Candlestick Chart
To Read Complete Report & Disclaimer Click Here
Please refer disclaimer at https://secure.icicidirect.com/Content/StaticData/Disclaimer.html
SEBI Registration number INZ000183631
Above views are of the author and not of the website kindly read disclaimer


Tag News

Stock Picks : TCS Ltd And Chambal Fertiliser Ltd By ICICI Direct