In the coming session, index is likely to open on a flat to negative note - ICICI Direct

Follow us Now on Telegram ! Get daily 10 - 12 important updates on Business, Finance and Investment. Join our Telegram Channel
Nifty: 15967
Technical Outlook
• The Nifty started the session on a positive note but failed to surpass Tuesday’s high (16158) and subsequently skidded downward. As a result, the daily price action formed a bear candle carrying lower high-low, indicating prolonged profit booking. In the process, broader market outperformed as Nifty midcap, small cap gained 0.2% each
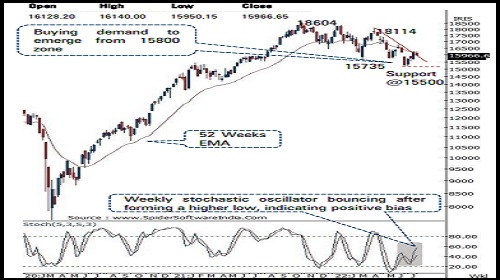
• The formation of lower high-low signifies extended breather amid stock specific as we enter the Q1FY23 earning season. Over the past three sessions, the index has retraced 38.2% of preceding five sessions up move (15511-16275), signifying healthy retracement of recent up move. Going ahead, bouts of volatility owing to global development on account of rising US inflation cannot be ruled out. However, we expect buy on dips strategy to remain fruitful for market participants. Thus, any dip from here on towards 15800- 15700 should be used as incremental buying opportunity as strong support for the Nifty is placed at July low of 15500. Eventually, we expect index to resolve higher and gradually head towards 16600 in coming weeks based on following observation:
• a) the index is hovering around the breakout zone of downward sloping trend line (drawn adjoining April-June highs), indicating conclusion of two months corrective phase
• b) current pullback is qualitatively better compared to earlier pullbacks since April, despite profit booking in the market the market breadth (measured by percentage of stocks above 50 DMA (~50%) strongest in two months) indicating broad based participation
• c) our target of 16600 is based on 50% retracement of CY22 decline (18350-15183) coincided with 200 days EMA
• The broader market indices have been relatively outperforming the benchmark, indicating stock specific action as we enter the Q1FY23 earning season. The Nifty midcap and small cap indices have been maintaining higher high-low formation on the weekly chart signifying buying demand at elevated support base. We expect broader market to endure their pullback in coming weeks. Thus, dips should be capitaslied to accumulate quality midcaps.
• In the coming session index is likely to open on a flat note tracking muted Asian cues. we expect buying demand to emerge from 15850- 15900 levels amid weekly expiry. Hence use dips towards 15880- 15912 for creating long position for the target of 15997
NSE Nifty Daily Candlestick Chart
Nifty Bank: 34827
Technical Outlook
• The daily price action formed a bear candle with a lower high - low signaling breather for the second consecutive session after a strong up move of 3000 points in the last three weeks
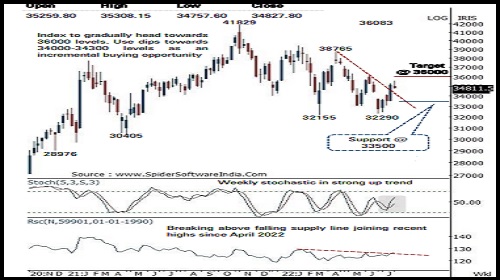
• The recent strong up move of the last three weeks has hauled daily stochastic at an overbought territory with a reading of 95 on Monday’s session . The last two sessions profit booking has led to a marginal cool off in the stochastic (currently at 73 ) indicating possibility of continuation of the temporary breather in the coming couple of sessions . However, the bias remain positive and dips towards 34000 -34300 levels should be used as an incremental buying opportunity for the next leg of up move towards 36000 levels in coming weeks as it is the confluence of :
• (a) the high of June 2022 is placed at 36083 levels
• (b) 61.8% retracement of the last 3 months’ decline (38765 - 32290 ) is also placed around 36200 levels
• Key observation in the recent market correction and during the last three -week pullback is that the Bank Nifty is relatively outperforming the Nifty . It is also highlighted in the Bank Nifty/Nifty ratio chart as it is seen breaking above the falling supply line joining recent highs highlighting strength and continuation of the current outperformance
• The formation of higher high -low in the weekly time fame make us confident to revise the support base higher towards 33500 levels as it is the confluence of the last week low and the 61 . 8 % retracement of the current up move (32290 -35543 )
• Among the oscillators, the weekly stochastic remain in strong up trend thus supports the overall positive bias in the index . In the coming session, index is likely to open on a flat to negative note amid muted Asian cues . We expect the index to trade in a range while holding above 34500 levels . Hence use intraday dips towards 34620 -34690 for creating long position for the target of 34940 , maintain a stoploss at 34495
Nifty Bank Index – Weekly Candlestick Chart
To Read Complete Report & Disclaimer Click Here
Please refer disclaimer at https://secure.icicidirect.com/Content/StaticData/Disclaimer.html
SEBI Registration number INZ000183631
Above views are of the author and not of the website kindly read disclaimer


Tag News

Stock Picks : TCS Ltd And Chambal Fertiliser Ltd By ICICI Direct


More News

Market Watch : Data filled week pose challenges to upsides - Geojit Financial Services Ltd