If NIFTY trades above this level then we may witness a further rally up to 15280-15350-15410 levels - Axis Securities

Follow us Now on Telegram ! Get daily 10 - 12 important updates on Business, Finance and Investment. Join our Telegram Channel
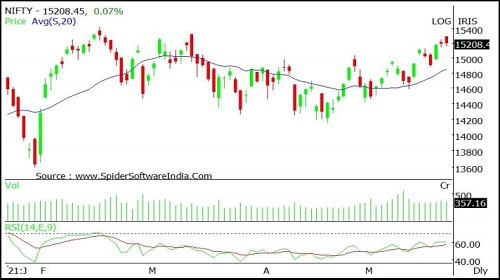
Nifty
Nifty opened with an upward gap but witnessed selling from the opening tick to end on a flat note. Nifty closed at 15208 with a gain of 11 points.
On the daily chart the index has formed a Bearish candle with long lower shadow indicating buying support at lower levels. The index is moving in a Higher Top and Higher Bottom formation on the daily chart indicating sustained up trend. The chart pattern suggests that if Nifty crosses and sustains above 15300 level it would witness buying which would lead the index towards 15400-15500 levels. However if index breaks below 15100 level it would witness selling which would take the index towards 15000-14900. Nifty is trading above its 20 day SMA which indicates positive bias in the short term. Nifty continues to remain in an uptrend in the medium and long term, so buying on dips continues to be our preferred strategy.
The daily strength indicator RSI has turned positive from the oversold territory and is above its reference line indicating sustained uptrend.
The trend deciding level for the day is 15220. If NIFTY trades above this level then we may witness a further rally up to 15280-15350-15410 levels. However, if NIFTY trades below 15220 levels then we may see some profit booking initiating in the market, which may correct up to 15150-15090-15020 levels
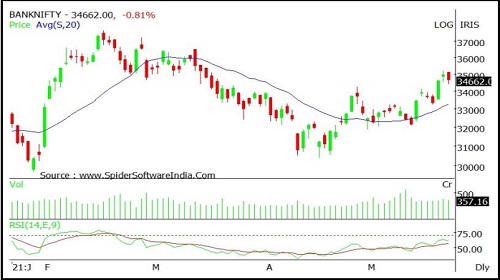
Banknifty
Banknifty opened with an upward gap but witnessed selling from the opening tick to end on a negative note. Banknifty closed at 34662 with a loss of 282 points.
On the daily chart index has formed a bearish candle however it remained restricted within previous session's High-Low range indicating absence of strength on either side. The index continues to move in a Higher Top and Higher Bottom formation on the hourly chart indicating positive bias. The chart pattern suggests that if Banknifty crosses and sustains above 35000 level it would witness buying which would lead the index towards 35500-35800 levels. Important Supports for the day is around 34500 However if index sustains below 34500 then it may witness profit booking which would take the index towards 34200-33900 levels.. Banknifty is trading above its 20 day SMA which indicates positive bias in the short term. Banknifty continues to remain in an uptrend in the medium and long term, so buying on dips continues to be our preferred strategy.
The daily strength indicator RSI has turned positive from the oversold territory and is above its reference line indicating sustained uptrend.
The trend deciding level for the day is 34735. If BANK NIFTY trades above this level then we may witness a further rally up to 35055-35450-35770 levels. However, if BANK NIFTY trades below 34735 levels then we may see some profit booking initiating in the market, which may correct up to 34340-34015-33625 levels
To Read Complete Report & Disclaimer Click Here
For More Axis Securities Disclaimer https://simplehai.axisdirect.in/disclaimer-home
SEBI Registration number is INZ000161633
Views express by all participants are for information & academic purpose only. Kindly read disclaimer before referring below views. Click Here For Disclaimer


More News
Daily Market Analysis : The broader indices traded in sync with the benchmark and lost nearl...