320-x-100_uti_gold.jpg" alt="Advertisement">

Gold returned to above $1,800 an ounce on Friday - Swastika Investmart
Follow us Now on Telegram ! Get daily 10 - 12 important updates on Business, Finance and Investment. Join our Telegram Channel
FUNDAMENTALS OF COMMODITY:
Gold returned to above $1,800 an ounce on Friday after tumbling beneath the key support level a day ago, but the yellow metal still finished the week down some 2% due setbacks dealt by the dollar and surging U.S. bond yields. For January, the United States added 49,000 jobs — just 1,000 less than forecast by economists. But the unemployment remained at a troubling 6.3% despite a drop of 0.4 percentage points. That reversed some of Thursday’s pop in the dollar, bringing some buyers back to gold.
MCX GOLD CHART
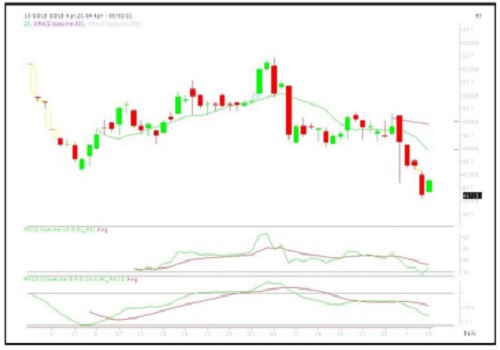
Technical indicators (Daily):
* RSI- 33.89
* MACD--795.52
* MOVING AVERAGES (20,50,100)- (48435/49407/49462)
Crude Oil
* Crude prices rose some 9% on the week but fell short of the S60 per barrel mark targeted by oil bulls, suggesting the market may be overbought in the short-term and could consolidate even if it hits that high point. U.S. gasoline RBOB futures meanwhile traded as high as $1.6729 a gallon, their highest since mid-February last year, when world oil demand began to collapse under the weight of the Covid-19 pandemic.
MCX CRUDE OIL CHART
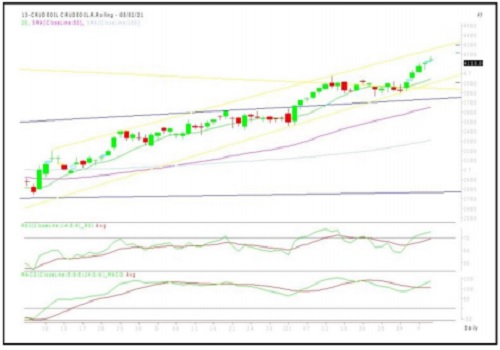
Technical indicators (Daily):
* RSI- 75.29
* MACD- 133.6
* MOVING AVERAGES (20,50,100)- (3651/3312/3903)
COPPER
Copper advanced on Tuesday, as strongerthan-expected economic data from top consumer China lent support, though rising COVID-19 infections globally weighed on prices and assuaged expectations of a swift economic recovery. China posted on Monday solid economic growth data in the last quarter of 2020, affirming that the world’s second-biggest economy is well on track for a recovery from the pandemic slump.
MCX COPPER CHART
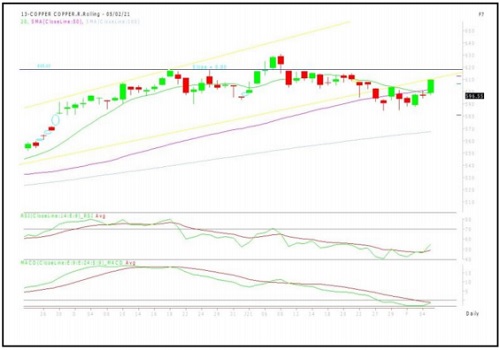
Technical indicators (Daily):
* RSI- 55.06
* MACD- -1.56
* MOVING AVERAGES (20,50,100) - (601.91/567.64/604.86)
To Read Complete Report & Disclaimer Click Here
Please refer disclaimer at https://www.swastika.co.in/disclaimer
Views express by all participants are for information & academic purpose only. Kindly read disclaimer before referring below views. Click Here For Disclaimer