320-x-100_uti_gold.jpg" alt="Advertisement">

Gold climbed above the $1,880 level an ounce on Friday - Swastika Investmart Ltd

Follow us Now on Telegram ! Get daily 10 - 12 important updates on Business, Finance and Investment. Join our Telegram Channel
FUNDAMENTALS OF COMMODITY:
* Gold climbed above the $1,880 level an ounce on Friday, extending gains for the seventh straight session, its longest winning streak since July 2020, amid general dollar weakness and falling Treasury yields. The precious metal has played a crucial role as an inflation-hedging asset as investors moved to price in a roaring comeback for the US economy and increased price pressures. Given the above and the fact that investors are ditching bitcoin in favour of gold, we could expect further upside in the short term. Bullion rallied more than 2% this week and so far is up more than 6% in May.
* Silver fell almost 1% to $27.50 an ounce on Friday, following strong PMI figures, which also pushed the greenback higher. Still, the metal end the week on a high note amid growing industrial demand as the economic recovery from the Covid-19 blow gathers pace. A global shift towards green technologies, such as solar panel production, lent further support for semi-precious metal.
* Oil prices moved higher on Friday, with WTI crude rising 2.6% to $63.58 a barrel and Brent settling at $66.44 a barrel, supported by weather-driven supply concerns as a storm formed in the Gulf of Mexico. On top of that, investors were upbeat about fuel demand recovery this summer, with vaccination programs in Europe and the US set to allow more people to travel. However, such optimism was not enough to offset worries about rising coronavirus cases in Asia and signs of progress in the US-Iran nuclear talks, which could bring more oil into an already oversupplied market.
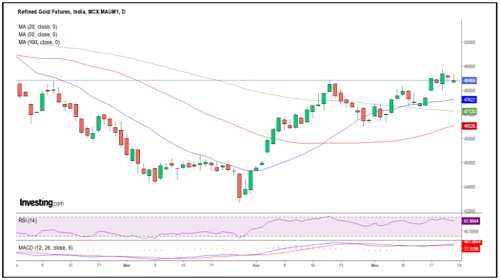
Technical indicators (Daily):
* RSI- 61.9044
* MACD- 479.5060
* MOVING AVERAGES (20,50,100)- (47622/46526/47128)
MCX GOLD CHART
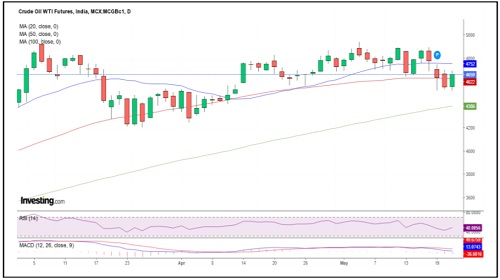
Technical indicators (Daily):
* RSI- 48.0056
* MACD- 13.0743
* MOVING AVERAGES (20,50,100)- (4752/4622/4386)
MCX CRUDE OIL CHART
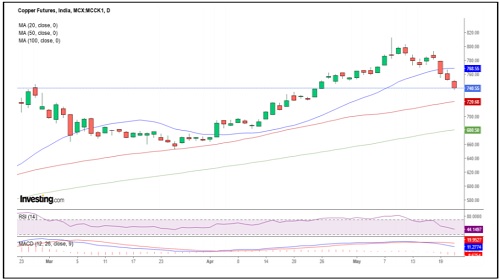
Technical indicators (Daily):
* RSI- 44.1497
* MACD- 11.2774
* MOVING AVERAGES (20,50,100) - (768.55/720.68/680.5)
MCX COPPER CHART
To Read Complete Report & Disclaimer Click Here
Please refer disclaimer at https://www.swastika.co.in/disclaimer
Views express by all participants are for information & academic purpose only. Kindly read disclaimer before referring below views. Click Here For Disclaimer