Equity market valuations remain stretched by most conventional yardsticks in its latest report - HDFC Securities

Follow us Now on Telegram ! Get daily 10 - 12 important updates on Business, Finance and Investment. Join our Telegram Channel
Indian markets could open lower following largely negative Asian markets today and despite positive US markets on Tuesday - HDFC Securities
U.S. stock indexes ended higher Tuesday, after a strongerthan-expected rise in October retail sales and as investors digested results from major retailers. Home Depot and Walmart reported strong results.
Retail sales jumped 1.7% in October, the government said, surpassing forecasts for a 1.5% rise and logging the biggest gain since March when households received billions in federal stimulus money. Excluding autos, sales rose 1.4%. Industrial production, which includes factory, mining and utility output, increased at a seasonally adjusted 1.6% in October compared to the previous month. Economists polled by The Wall Street Journal expected a 0.8% increase
Fitch Ratings on Tuesday kept India's sovereign rating unchanged at 'BBB-' with a negative outlook, and said that the rating balances a still-strong medium-term growth outlook and external resilience from solid foreign-reserve buffers against high public debt, a weak financial sector and some lagging structural issues. It forecast robust GDP growth of 8.7 per cent in the fiscal year ending March 2022 (FY22) and 10 per cent in FY23 (ending March 2023).
Most Asian stocks dipped Wednesday after robust U.S. economic data lifted Wall Street shares, Treasury yields and the dollar and spurred more calls for tighter monetary policy.
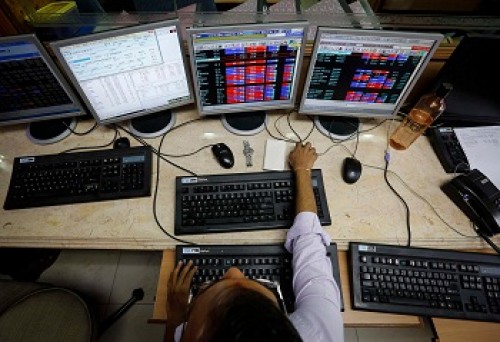
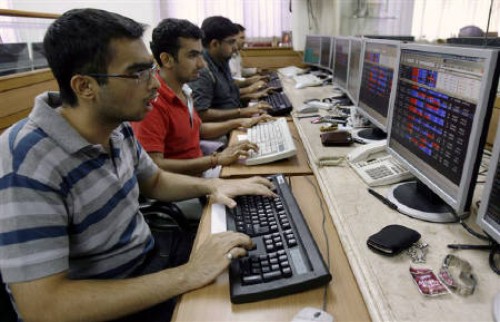
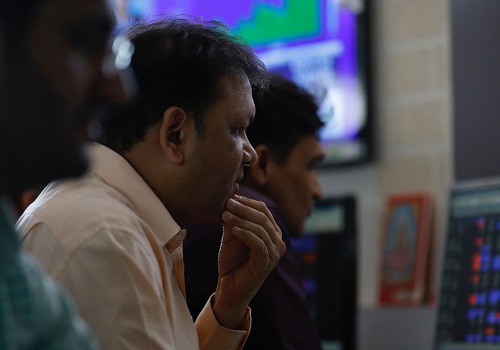
Nifty closed lower on Nov 16 as investors were concerned about inflation and RBI’s view that equity market valuations remain stretched by most conventional yardsticks in its latest report. In the process Nifty closed below 18000. At close Nifty was down 0.61% or 110.2 points at 17999.2. Nifty respected the doji formation on the previous day and sold off on Nov 16. 18102-18139 is the resistance band now for the Nifty while 17874-17906 is the support band. Volumes and advance decline ratio continue to disappoint.
Daily Technical View on Nifty
Market: Observation
* Markets corrected sharply on Tuesday after a volatile session. The Nifty finally lost 110.25 points or 0.61% to close at 17,999.2. .
* Broad market indices like the BSE Small Cap index ended higher, thereby out performing the Sensex/Nifty. Market breadth was negative on the BSE/NSE.
Nifty: 15 min charts indicates consolidation
* Zooming into the 15 minute chart, we can see that the Nifty opened on a weak note and recovered smartly in the late morning session to enter into positive territory. But selling once again resumed in the afternoon session and pulled the index into negative territory.
* On the 15 min chart, we can observe that the Nifty has broken its immediate supports. There has also been a moving average crossover on the 15 min chart as the 20 period MA has moved below the 50 period MA. This indicates more weakness in the very near term.
Nifty: Trading below the 20 day SMA
* On the daily chart, we can see that the Nifty has once again moved below the 20 day SMA after briefly moving above it.
* The Nifty is likely to drift down further towards the next major supports of 17905-17798 in the coming sessions. Any pullback rallies could find resistance at 18133.
Nifty – Daily Timeframe chart

To Read Complete Report & Disclaimer Click Here
Please refer disclaimer at https://www.hdfcsec.com/article/disclaimer-1795
SEBI Registration number is INZ000171337
Views express by all participants are for information & academic purpose only. Kindly read disclaimer before referring below views. Click Here For Disclaimer


Tag News

Nifty registers best week in 2 months after rising for 6 consecutive sessions