320-x-100_uti_gold.jpg" alt="Advertisement">

Crude oil price making falling wedge pattern - Kedia Advisory

Follow us Now on Telegram ! Get daily 10 - 12 important updates on Business, Finance and Investment. Join our Telegram Channel
Highlights
? Crude oil gains as global oil demand growth will rebound strongly next year as China eases lockdowns.
? U.S. crude, distillate stocks rise in most recent week – EIA
? Crude inventories rose by 2.4 million barrels in the week to Sept. 9 to 429.6 million barrels
? U.S. gasoline stocks fell by 1.8 million barrels in the week, compared with expectations for an 858,000-barrel drop.
? Oil output in the Permian in Texas and New Mexico, is due to rise by 66,000 bpd to a record 5.413 mbpd in October, the U.S. Energy Information Administration (EIA) said.
? Total output in the major U.S. shale oil basins will rise 132,000 bpd to 9.115 million bpd in October, the highest since March 2020, the EIA projected.
? U.S. crude production and petroleum demand will both rise in 2022 as the economy grows, the U.S. Energy Information Administration (EIA) said.
? OPEC sticks to oil demand growth view and sees pre-pandemic demand in 2023
? Demand to top pre-pandemic level in 2023 - OPEC
? OPEC August output up 618,000 bpd on Libya rebound - OPEC
? Saudi Arabia says its output topped 11 mbpd in August - OPEC
? Oil demand set to stop growing in Q4 as slowdown bites – IEA
? Global oil demand remains under pressure from the faltering Chinese economy and an ongoing slowdown in OECD economies – IEA
? IEA cut its forecast for demand growth this year by 110,000 bpd to 2 mbpd while keeping its 2023 growth forecast of 2.1 mbpd.
? Crude in U.S. emergency reserve falls to lowest since Oct 1984
? OPEC August output up 618,000 bpd on Libya rebound
? US EIA lifts 2022 world oil demand growth forecast
? Money managers cut their net long U.S. crude futures and options positions in the week to September 6, the U.S. CFTC said.
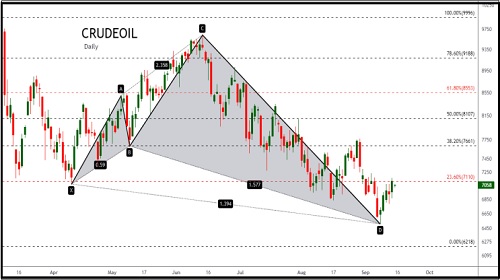
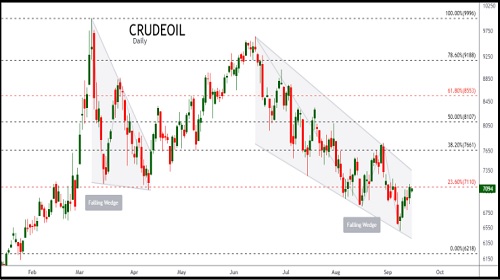
ACTION: Crude oil price making falling wedge pattern, a break above 7120 will keep the bullish trend scenario active for the level at 7350 and above same can test 7650 as long as prices are above 6550.
View
Crudeoil on MCX is currently trading near 7058. It forms Gartley Bullish Harmonic and Falling Wedge Pattern on the daily chart. Prices are currently trading below the 50-day moving average and below the 200-day moving average. Ichimoku indicators suggest prices are currently in the negative zone. RSI suggests prices are currently in the overbought zone. Markets are expected to trade with volatility in the coming trading sessions. Markets are expected to trade with bullish sentiments as the stochastic oscillator is mirroring an increase in strength in prices and is endorsing additional gains in the coming trading sessions.
We have scanned the charts technically and found the following reading:
? Relative Strength Index (RSI): As per the Daily chart of Crudeoil, RSI (Relative Strength Index) is currently trading at 47.83, which supports the bullish strength. The RSI is a momentum-based technical indicator that oscillates between 0 and 100. The RSI can be used to identify trends and momentum. As per our analysis, we can say that an extended upside is possible in the prices for the next few sessions, and we can expect fresh buying to be seen. The daily strength indicator RSI is in bullish mode and if it sustains in this mark, it will support bullish sentiments ahead.
? Choppiness Index: As per the Daily chart of Crudeoil, Choppiness Index is trading at 37, which is showing that prices are in a very high volatility zone. A smart investor could clear their position as the price will come in a range bound after the chop line breaches the 38.20 level. The Choppiness Index indicator is a volatility indicator that determines whether the market is following a trend or the market is choppy and trading sideways.
? Moving Averages: As per the Daily chart, the Crudeoil price is trading at the 7058 level, which is below the 50 simple moving average of 7414 and 200 simple moving average of 7486, which acts as a very strong resistance level, so it is expected that a bearish rally will continue till the price is below both the moving averages, a bearish investor can look at this, can square off long positions and start making new positions on sell side. A simple moving average (SMA) is a widely used technical indicator that smooths out price trends by filtering out the noise from random short-term price fluctuations.
? Fisher Transform: As per the technical indicator Fisher Transform on the Daily chart of the Crudeoil, we can see the value of which is at -0.06 which suggests that it is now at a fair zone but as the trend is signaled upwards traders could look to create long positions as a bullish rally could restart. The Fisher Transform indicator is an oscillator that helps to identify trend reversals and can be applied to any financial instrument. The Fisher Transform can be used to identify extremes in the market. These extremes represent the levels where prices normally begin to revert to a more normalized state.
To Read Complete Report & Disclaimer Click Here
Views express by all participants are for information & academic purpose only. Kindly read disclaimer before referring below views. Click Here For Disclaimer