320-x-100_uti_gold.jpg" alt="Advertisement">

Copper, Natural Gas, Silver and Zinc Commodity Report Of 17/08/2021 - Enrich Financial Solution
Follow us Now on Telegram ! Get daily 10 - 12 important updates on Business, Finance and Investment. Join our Telegram Channel
COPPER
Technical outlook
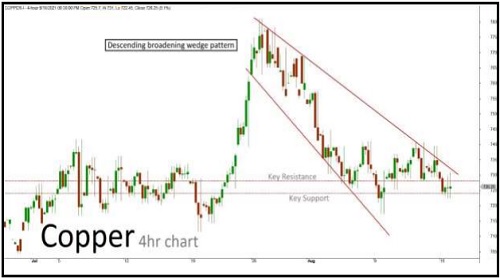
Copper Aug future 4hr chart has formed "Descending broadening wedge" pattern. There were some corrections within the channel in the last few sessions while the market remained sideways. The market is expected to continue on bearish momentum based on the current price action, once the same break below the current key support holding near 724.
The downside rally could be testing all the way up to 721-718 levels in the upcoming sessions. Alternatively, if the market struggles to break the support level, then it might revise the trend to bullish/sideways mode. Key resistance holds at 728. A slide to 731-734 is also a possibility if the price makes or break above the current resistance level.
Technical Chart
To Read Complete Report & Disclaimer Click Here
NATURAL GAS
Technical outlook
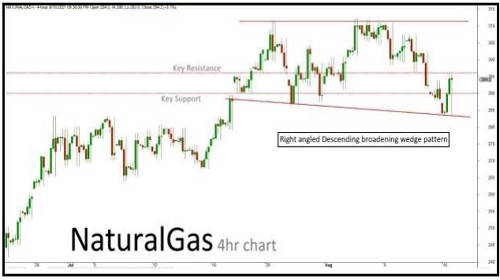
Natural gas 4hr chart has formed “Right angled descending broadening wedge” pattern. Over the last few sessions, we have seen sideways movement along with a few corrections inside the channel. The market is expected to continue on the bullish momentum based on the price action, once break above a key resistance holding near 296.
The upside rally could be testing all the way through 299-302 levels in the upcoming sessions. Alternatively, if the market struggles to break the resistance level, then it might retest the same and turn bearish/sideways once again. Key support holds at 290. A slide to 287 is also a possibility if the price makes or break below the current support level.
Technical Chart
To Read Complete Report & Disclaimer Click Here
SILVER
Technical outlook
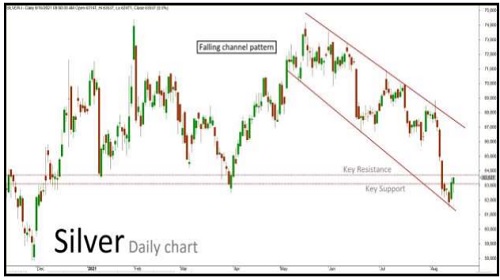
MCX Silver Sept futures technical chart has taken the formation of "Falling channel" pattern in daily time frame. There have been a few sideways sessions along with slight corrections retesting near the channel’s support line. The market is expected to continue on bullish momentum based on the current price action, once the same break above the key resistance level holding near 63700.
The upside rally could be extending all the way up to 64300-64900 levels in the upcoming sessions. An alternative scenario indicates that if the market struggles to break the resistance level, then it might retest the same and revise the trend to bearish/sideways mode once again. Key support holds near 63100. A slide to 62500- 61900 is also a possibility if the price makes or break below the current support level.
Technical Chart
To Read Complete Report & Disclaimer Click Here
ZINC
Technical outlook
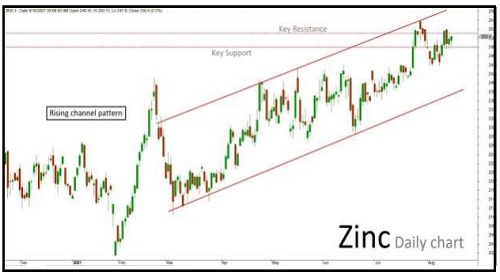
Zinc Aug future daily Chart has formed "Rising channel" pattern. The last few sessions ended up sideways mode along with some corrections inside the channel. The market is expected to continue on the bullish term based on the current price action, once the same breaks above the current key resistance holding near 251.
The upside rally could be testing all the way up to 252.50-254 levels in the upcoming sessions. Alternatively, if the market struggles to break the resistance level, then it might retest the same and revise the trend to bullish/sideways. Key support holds at 248. A slide to 246.50 is also a possibility if the price makes or break below the current support level.
Technical Chart
To Read Complete Report & Disclaimer Click Here
Please refer disclaimer at https://enrichbroking.in/disclaimer
SEBI Registration number is INZ000078632
Views express by all participants are for information & academic purpose only. Kindly read disclaimer before referring below views. Click Here For Disclaimer