Banknifty opened with downward gap and selling pressure throughout the session led it to close - Axis Securities

Follow us Now on Telegram ! Get daily 10 - 12 important updates on Business, Finance and Investment. Join our Telegram Channel
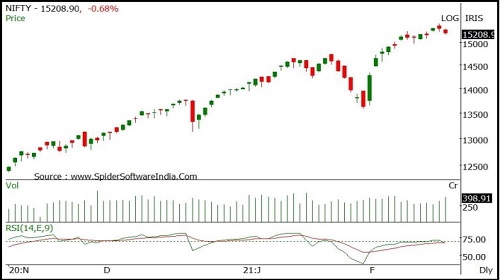
Nifty
Nifty opened sharply lower with a downward gap and selling pressure throughout the session dragged it lower to close on a negative note. Nifty closed at 15209 with a loss of 105 points. On the daily chart the index has formed a bearish candle but is currently trading at all time highs indicating that current price action might just be a pullback. The index continues to move in a Higher Top and Higher Bottom formation on the hourly chart indicating positive bias. The chart pattern suggests that if Nifty breaks and sustains below 15100 level it would witness selling which would lead the index towards 15000-14800 levels. Important Resistances for the day are placed at 15500-15600. Nifty is trading above its 20 day SMA which indicates positive bias in the short term. Nifty continues to remain in an uptrend in the medium and long term, so buying on dips continues to be our preferred strategy. The daily strength indicator RSI continue to remian flat and is above its reference line indicating absence of momentum on either side The trend deciding level for the day is 15230. If NIFTY trades above this level then we may witness a further rally up to 15290-15375-15435 levels. However, if NIFTY trades below 15230 levels then we may see some profit booking initiating in the market, which may correct up to 15150-15090-15005 levels
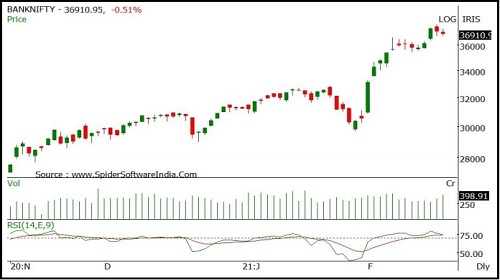
Banknifty
Banknifty opened with downward gap and selling pressure throughout the session led it to close near day's low. Banknifty closed at 36911 with a loss of 187 points. On the daily chart index has formed a bearish candle however it remained restricted within previous session's High-Low range indicating absence of strength on eitherside. The index continues to move in a Higher Top and Higher Bottom formation on the hourly chart indicating positive bias. The chart pattern suggests that if Banknifty crosses and sustains above 37300 level it would witness buying which would lead the index towards 37800-38200 levels. However if index breaks below 36700 level it would witness selling which would take the index towards 36300-36000. Banknifty is trading above 20 and 50 day SMA's indicating positive bias in the short to medium term. Banknifty continues to remain in an uptrend in the medium and long term, so buying on dips continues to be our preferred strategy. The daily strength indicator RSI continue to remian flat and is below its reference line indicating absence of momentum on either side The trend deciding level for the day is 37000. If BANK NIFTY trades above this level then we may witness a further rally up to 37240-37570-37805 levels. However, if BANK NIFTY trades below 37000 levels then we may see some profit booking initiating in the market, which may correct up to 36675-36435-36105 levels
To Read Complete Report & Disclaimer Click Here
For More Axis Securities Disclaimer https://simplehai.axisdirect.in/disclaimer-home
SEBI Registration number is INZ000161633
Views express by all participants are for information & academic purpose only. Kindly read disclaimer before referring below views. Click Here For Disclaimer