Banknifty opened with an upward gap and witnessed selling for first part of the session - Axis Securities

Follow us Now on Telegram ! Get daily 10 - 12 important updates on Business, Finance and Investment. Join our Telegram Channel
Nifty
Nifty opened with an upward gap and formed shadows on either side indicating lack of bullish confidence amongst participants. Nifty closed at 14507 with a gain of 182 points.
On the daily chart the index has formed a small bullish candle with shadows on either side representing extreme volatility as well as indecisiveness amongst participants regarding the direction. The index continues to move in a Lower Top and Lower Bottom formation on the hourly chart indicating negative bias. The chart pattern suggests that if Nifty crosses and sustains above 14600 level it would witness buying which would lead the index towards 14750-14900 levels. However if index breaks below 14400 level it would witness selling which would take the index towards 14250-14100. Nifty is trading below 20 day SMA indicating negative bias in the short to medium term. Nifty continues to remain in an uptrend in the medium and long term, so buying on dips continues to be our preferred strategy.
The daily strength indicator RSI has turned negative from the overbought territory and is below its reference line indicating sustained downtrend.
The trend deciding level for the day is 14500. If NIFTY trades above this level then we may witness a further rally up to 14580-14655-14740 levels. However, if NIFTY trades below 14500 levels then we may see some profit booking initiating in the market, which may correct up to 14425-14340-14265 levels

Banknifty
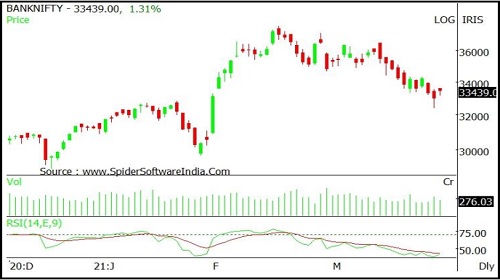
Banknifty opened with an upward gap and witnessed selling for first part of the session. However last hour pullback action pulled index higher and recovered some of the earlier losses. Banknifty closed at 33318 with a gain of 312 points.
On the daily chart the index has formed a Bearish candle with a lower shadow indicating buying at lower levels. The index is moving in a Lower Top and Lower Bottom formation on the daily chart indicating negative bias. The chart pattern suggests that if Banknifty breaks and sustains below 33100 level it would witness selling which would lead the index towards 32700-33400 levels. However if index crosses above 33700 level it would witness pullback rally which would take the index towards 34000-34300. Banknifty is trading below 20 day SMA indicating negative bias in the short to medium term. Banknifty continues to remain in an uptrend in the medium and long term, so buying on dips continues to be our preferred strategy.
The daily strength indicator RSI is moving downwards and is quoting below its reference line indicating negative bias.
The trend deciding level for the day is 33365. If BANK NIFTY trades above this level then we may witness a further rally up to 33565-33810-34010 levels. However, if BANK NIFTY trades below 33365 levels then we may see some profit booking initiating in the market, which may correct up to 33120-32920-32675 levels
To Read Complete Report & Disclaimer Click Here
For More Axis Securities Disclaimer https://simplehai.axisdirect.in/disclaimer-home
SEBI Registration number is INZ000161633
Views express by all participants are for information & academic purpose only. Kindly read disclaimer before referring below views. Click Here For Disclaimer


More News

Market Wrap by Shrikant Chouhan, Head Equity Research, Kotak Securities