Adani Ports rises on handling cargo volume of 34 MMT in July
Adani Ports and Special Economic Zone is currently trading at Rs. 770.60, up by 4.90 points or 0.64% from its previous closing of Rs. 765.70 on the BSE.
The scrip opened at Rs. 767.00 and has touched a high and low of Rs. 774.00 and Rs. 758.30 respectively. So far 83790 shares were traded on the counter.
The BSE group 'A' stock of face value Rs. 2 has touched a 52 week high of Rs. 987.90 on 20-Sep-2022 and a 52 week low of Rs. 394.95 on 03-Feb-2023.
Last one week high and low of the scrip stood at Rs. 780.95 and Rs. 742.15 respectively. The current market cap of the company is Rs. 167119.15 crore.
The promoters holding in the company stood at 62.89%, while Institutions and Non-Institutions held 29.44% and 7.68% respectively.
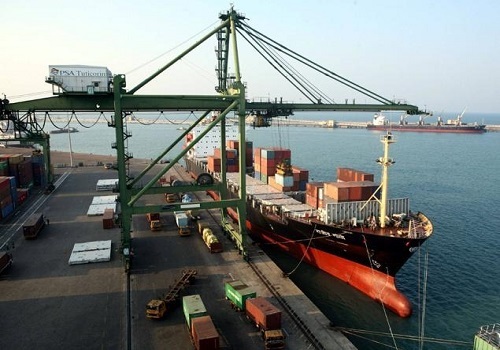
Adani Ports and Special Economic Zone has recorded bumper cargo volumes of 34 MMT (including around 1 MMT at its Haifa Port) in July, 2023, which is a good 7% Year- on -Year (YoY) jump. Growth observed across most ports, with containers (+23%) and liquids & gas (+27%) driving these volumes increase.
During the initial four months (April-July) of FY24, APSEZ has handled 135.4 MMT of total cargo, implying a strong 11% YoY growth. Logistics volumes continue to record significant jump with YTD rail volumes of 178,689 TEUs (+20% YoY) and GPWIS volumes of 5.77 MMT (+39%).
Adani Ports and Special Economic Zone, a part of globally diversified Adani Group, is the largest integrated logistics player in India.
