Indian equity benchmarks snapped a three-day losing streak, tracking firm global cues - ICICI Direct

Nifty : 24620
Technical Outlook
Day that was…
* Indian equity benchmarks snapped a three-day losing streak, tracking firm global cues. The Nifty settled at 24,620, up 77 points. Market breadth was in favor of advances, with an A/D ratio of 1.30:1, as the broader market outperformed. Sectorally, barring Realty, all sectors closed in the green, with Oil & Gas, Metal, and IT leading the gains.
Technical Outlook:
* After an initial decline, the index managed to hold the two-day identical low, resulting in supportive efforts near the lower band of consolidation (24,500). This led to the formation of an Inside Bar, indicating a breather after Tuesday’s session’s sell-off.
* Despite Tuesday’s sizeable bearish candle, the lack of follow-through momentum on the downside indicates inherent strength and supportive buying at lower levels. The rally from the 7th April low to the 15th May high witnessed only a shallow correction, with the maximum decline being 650 points. In the current scenario, such a correction would mature around the 24,500 level. In Wednesday’s session, the index successfully defended this 24,500 level, highlighting buying interest at the lower band of consolidation. As long as the index holds above 24,500 on a closing basis, we expect the consolidation to continue within the broader range of 24,500–25,100. Only a breach below 24,500 would lead to an extended correction, with strong support placed at 24,200. In the interim, bouts of volatility are expected, with all eyes on the upcoming RBI Policy announcement (scheduled for this Friday). Consequently, rate-sensitive sectors like Financials, Auto, and Realty will be in focus.
* Key thing to highlight is that, the index has staged a strong 15% rally from April lows. Post that, Nifty has been consolidating over past two weeks wherein it corrected 3%. The elongation of rallies followed by shallow retracement is a key ingredient of a structural bull market. Any decline should be used as buying opportunity.
* On the broader market front, the ratio chart of Nifty 500 / Nifty 100 has staged a strong rebound after finding support from multi years range breakout area. The rising ratio line highlights relative outperformance of the broader market compared to large caps. Meanwhile sector rotation underpinned by improvement in market breadth augurs well for durability of ongoing optimism in the midcap and small cap space. Additionally, market breadth has improved notably, with 48% of Nifty 500 stocks now trading above their 200- DMA, compared to a low of 25% in May. This clearly indicates a broadening of market participation.
* Key monitorable which would validate our positive bias going ahead:
* a) RBI's commentary on rate cut
* b) Further weakness in US Dollar index and Brent crude oil prices
* c) Bilateral Trade Agreement between India and US
* The index is consolidating between (25100-24200). We maintain our support base at 24200 as it is the gap zone support (24378-24164) and 38.20% retracement of recent rally (21743-24944).

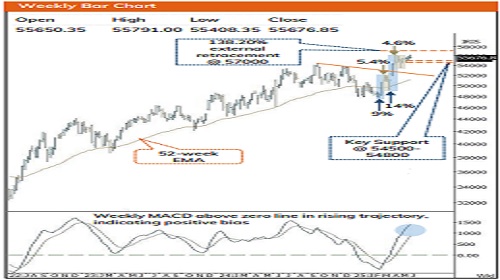
Nifty Bank : 55677
Technical Outlook
Day that was :
* The Bank Nifty ended on a positive note amid firm global cues . The index settled at 55 ,677 , up 77 points . The Nifty Pvt Bank index underperformed the benchmark, but still closed on a positive note at 27 ,369 , up 22 points .
Technical Outlook :
* The index started the day on a flat note, and after an initial decline, buying demand emerged near the previous session’s low, coinciding with the falling trendline . It retested the aforementioned trendline, which helped the index recover most of the intraday losses and close the session on a flat note . The daily price action formed a Doji candle, signaling a breather after Tuesday’s sell -off .
* Key point to highlight is that, after breaking out from a contracting triangle, the index is forming a higher base while maintaining its higher -high -low formation indicating a robust price structure . Wednesday’s session witnessed a retest of the breakout levels, reinforcing their validity and hinting at a possible follow -through move . Going forward, a decisive close and sustenance above the all - time high level would accelerate the move towards the 57 ,000 mark, which represents the 138 .20 % external retracement of the decline from 56 ,098 to 53 ,483 . Meanwhile, strong support is placed at 54 ,500 –54 ,800 , which marks the 61 .80 % retracement of the recent up -move (53 ,483 –55 ,903 ) and coincides with the gap area seen on 12th May (54 ,055 –54 ,442 ) . Concurrently, volatility is expected to persist ahead of the RBI monetary policy, and any decline from current levels would offer incremental buying opportunities .
* Structurally, the Bank Nifty is witnessing an elongation of rallies followed by shallow retracements, signifying a robust price structure . The recent up -move of 14 % is stronger compared to the previous month’s 9 % rise . Additionally, the declines are becoming shallower, with the recent one being 4 . 6 % versus 5 . 4 % in March 2025 . Furthermore, the index broke out of an eight -month falling trendline and surpassed its lifetime high, highlighting continued strength .
* Mirroring the benchmark, the PSU Bank index witnessed buying interest around the previous session’s low and closed on a positive note . The index broke out from an eleven -month falling trendline on 19th May and, since then, has been forming a higher -high -low structure, indicating strong upside momentum . While the Bank Nifty is trading near its all -time high, the PSU Bank index is still trading ~13 % below its all -time high, presenting a compelling case for a catch -up move . Meanwhile, immediate support on the downside is placed at 6 ,700 , which is the 38 .20 % retracement of the rally from 7th April 2025 to 3rd June 2025 and coincides with the 20 -day EMA .
Please refer disclaimer at https://secure.icicidirect.com/Content/StaticData/Disclaimer.html
SEBI Registration number INZ000183631