Nifty started the week with an upward gap and buying momentum - Axis Securities

Follow us Now on Telegram ! Get daily 10 - 12 important updates on Business, Finance and Investment. Join our Telegram Channel
https://t.me/InvestmentGuruIndiacom
Download Telegram App before Joining the Channel
Nifty
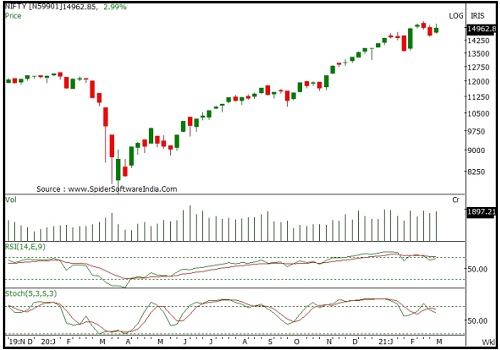
Nifty started the week with an upward gap and buying momentum for most part of the week led it to close in positive territory. Nifty closed at 14938 with a gain of 409 points on a weekly basis. On the weekly chart the index has formed a long Bullish candle forming higher High-low compared to previous week however it carries long upper shadow indicating resistance at higher levels .
The index is moving in a Higher Top and Higher Bottom formation on the weekly chart indicating positive bias. The chart pattern suggests that if Nifty crosses and sustains above 15100 level it would witness buying which would lead the index towards 15300-15500 levels. Important Support for the week is around 14600-14400.
Nifty is now well placed above its 50 and 100 SMA indicating positive bias in the short term. Nifty continues to remain in an uptrend in the medium term, so buying on dips continues to be our preferred strategy. For the week, we expect Nifty to trade in the range of 15500-14400 with a positive bias. The weekly strength indicator RSI and momentum oscillator Stochastic have both turned negative and are below their respective reference lines indicating negative bias. The trend deciding level for the day is 14965.
If NIFTY trades above this level then we may witness a further rally up to 15065-15195-15295 levels. However, if NIFTY trades below 14965 levels then we may see some profit booking initiating in the market, which may correct up to 14835-14735-14605 levels.
Bank Nifty
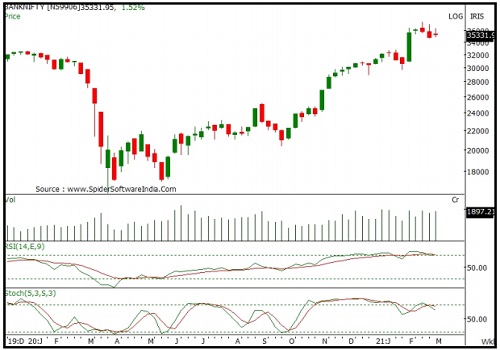
Bank Nifty started the week on a positive note and traded with extreme volatility on either side throughout the week. Bank Nifty closed at 35228 with a gain of 425 points on a weekly basis. On the weekly chart the index has formed a "Doji" candlestick formation indicating indecisiveness amongst market participants regarding the direction. The index is moving in a Higher Top and Higher Bottom formation on the weekly chart indicating sustained up trend on long term charts.
The chart pattern suggests that if Bank Nifty crosses and sustains above 35800 level it would witness buying which would lead the index towards 36500-37200 levels. However if index breaks below 34800 level it would witness selling which would take the index towards 34000-33500. On the daily chart, Bank Nifty is now sustaining below its 20 day SMA indicating negative bias in the short term. Bank Nifty continues to remain in an uptrend in the medium term, so buying on dips continues to be our preferred strategy. For the week, we expect Bank Nifty to trade in the range of 36500-34000 with mixed bias.
The weekly strength indicator RSI and momentum oscillator Stochastic have both turned negative and are below their respective reference lines indicating negative bias The trend deciding level for the day is 35245 If BANKNIFTY trades above this level then we may witness a further rally up to 35600-35970-36320 levels. However, if BANKNIFTY trades below 35245 levels then we may see some profit booking initiating in the market, it may correct up to 34875-34525-34155 levels.
To Read Complete Report & Disclaimer Click Here
For More Axis Securities Disclaimer https://simplehai.axisdirect.in/disclaimer-home
SEBI Registration number is INZ000161633
Views express by all participants are for information & academic purpose only. Kindly read disclaimer before referring below views. Click Here For Disclaimer