Nifty opened sharply lower with a downward gap and traded with extreme volatility - Axis Securities

Follow us Now on Telegram ! Get daily 10 - 12 important updates on Business, Finance and Investment. Join our Telegram Channel
https://t.me/InvestmentGuruIndiacom
Download Telegram App before Joining the Channel
Nifty
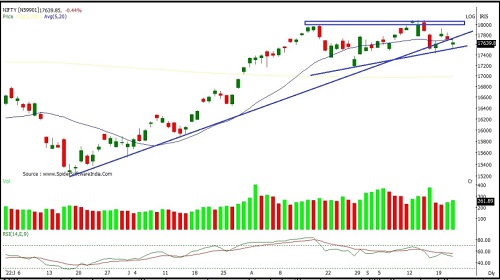
Nifty opened sharply lower with a downward gap and traded with extreme volatility throughout the session to close on a negative note. Nifty closed at 17630 with a loss of 89 points.
On the daily chart the index has formed a small Bearish candle with shadows on either side indicating indecisiveness amongst participants regarding the direction. Index is forming a small ascending triangular pattern. Index is facing a resistance at 18100 level whereas it is holding a lower band of triangle which is currently placed at 17500. The index is moving in a Higher Top and Higher Bottom formation on the daily chart indicating a sustained up trend. The chart pattern suggests that if Nifty crosses and sustains above 17700 level it would witness buying which would lead the index towards 17800-17900 levels. Important support for the day is around 17500 However if index sustains below 17500 then it may witness profit booking which would take the index towards 17400-17300 levels.. Nifty is trading above 50, 100 and 200 day SMA indicating positive bias in the short to medium term. Nifty continues to remain in an uptrend for the short term, so buying on dips continues to be our preferred strategy.
The daily strength indicator RSI is moving downwards and is quoting below its reference line indicating negative bias.
The trend deciding level for the day is 17630. If NIFTY trades above this level then we may witness a further rally up to 17725-17820-17915 levels. However, if NIFTY trades below 17630 levels then we may see some profit booking initiating in the market, which may correct up to 17535-17440-17345 levels.
Banknifty
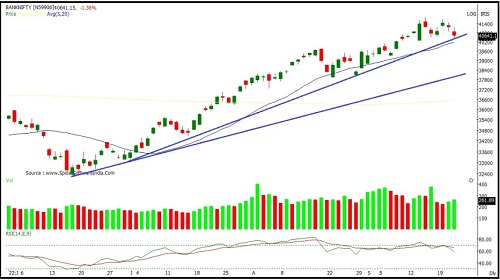
Banknifty opened with a downward gap and traded with extreme volatility on either side to close on a negative note. Banknifty closed at 40631 with a loss of 573 points
On the daily chart the index has formed a small Bearish candle with shadows on either side indicating indecisiveness amongst participants regarding the direction. The index is moving in a Higher Top and Higher Bottom formation on the daily chart indicating a short term up trend. The chart pattern suggests that if Banknifty crosses and sustains above 40800 level it would witness buying which would lead the index towards 41000-41200 levels. Important support for the day is around 40200 However if index sustains below 40200 then it may witness profit booking which would take the index towards 40200- 40000 levels.. Banknifty is sustaining above its 20, 50, 100 and 200- day SMA which signals bullish sentiments in near term. Banknifty continues to remain in an uptrend in the medium and long term, so buying on dips continues to be our preferred strategy
The daily and weekly strength indicator RSI is moving downwards and is quoting below its reference line indicating negative bias.
The trend deciding level for the day is 40715. If BANK NIFTY trades above this level then we may witness a further rally up to 41075-41515-41870 levels. However, if BANK NIFTY trades below 40715 levels then we may see some profit booking initiating in the market, which may correct up to 40275- 39920-39475 levels.
To Read Complete Report & Disclaimer Click Here
For More Axis Securities Disclaimer https://simplehai.axisdirect.in/disclaimer-home
SEBI Registration number is INZ000161633
Views express by all participants are for information & academic purpose only. Kindly read disclaimer before referring below views. Click Here For Disclaimer