

No Record Found
Latest News

Andhra Pradesh to establish research centre AP FIRST...
Buy Polycab India Ltd For Target Rs.9,600 by Motilal...

National Startup awardees hail mushrooming of start-...

Startup founders hail government initiatives to empo...

Reliance Industries clocks Rs 18,645 crore net profi...
Buy Nuvoco Vistas Corporation Ltd For Target Rs. 438...
.jpg)
Accumulate Federal Bank Ltd For Target Rs.290 By 1 ...

Hold L&T Technology Services Ltd For Target Rs. 4,60...
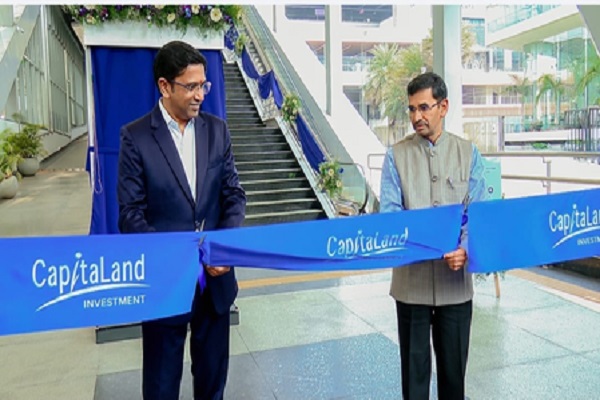
Metro Skywalk inaugurated at International Tech Park...
Buy Infosys Ltd For Target Rs. 1,820 By Axis Securit...
Top News
News Not Found
Tag News
News Not Found
More News
News Not Found