Zinc trading range for the day is 404.2-436.8 - Kedia Advisory

Gold
Gold settled down 0.21% at Rs162,882, pressured by profit-taking and a firmer dollar ahead of the U.S. Personal Consumption Expenditures inflation data and Federal Reserve Chair Kevin Warsh’s remarks at the Jackson Hole symposium. Despite the short-term correction, underlying investment demand remained supportive, with gold-backed ETFs attracting 46.7 tonnes worth $6.4 billion last week, marking their strongest weekly inflow in 10 months. Markets are pricing a 40% probability of a U.S. rate hike in September, while the remaining 60% expectation is for rates to remain unchanged, keeping monetary-policy uncertainty elevated. In Asia, China’s net gold imports through Hong Kong rose 11% month-on-month to 56.193 tonnes in July, while the People’s Bank of China purchased 19.9 tonnes, its largest monthly addition since October 2023. However, physical demand in India remained subdued, with dealers offering discounts of up to $65 per ounce as elevated prices discouraged retail buying. India’s net gold imports fell 23% year-on-year to 98.1 tonnes in the June quarter, while overall demand declined 6% to 131.4 tonnes. Globally, second-quarter gold demand remained steady at 1,268.9 tonnes, supported by central-bank purchases of 289 tonnes, which increased fivefold from the first quarter. London vault holdings reached 9,464 tonnes at end-June, up 0.77% month-on-month. India’s higher 15% import tariff has also encouraged unofficial inflows and pressured organised market participants. Technically, gold is under long liquidation, with open interest declining 3.86% to 10,134 while prices fell Rs347. Immediate support is placed at Rs161,780, followed by Rs160,675, while resistance is seen at Rs163,895 and Rs164,905. A sustained break below support could extend the correction, whereas a move above Rs163,895 may revive bullish momentum toward Rs164,905.
Trading Ideas:
* Gold trading range for the day is 160675-164905.
* Gold eased amid profit-taking and a firmer dollar ahead of U.S. inflation data and remarks from Fed Chairman Warsh.
* Iran vowed to retaliate against expanded U.S. economic sanctions that the Americans said would cut off Iran's economic lifeline.
* Gold-backed ETFs attracted inflows of 46.7 metric tons ($6.4 billion) last week, the largest weekly demand in 10 months - WGC
Silver
Silver settled marginally lower by 0.04% at Rs244,127 as the dollar index steadied near 99 on safe-haven demand following fresh U.S. sanctions targeting Iran. However, the greenback remained close to three-month lows as the U.S. Treasury expanded its buyback programme for long-dated government debt, raising concerns about debt sustainability and potentially limiting dollar strength. Market participants are closely watching the U.S. PCE inflation data and Federal Reserve Chair Kevin Warsh’s Jackson Hole speech for signals on the future monetary-policy path. Fundamentally, silver continues to benefit from tight physical availability, with the market heading toward a sixth consecutive year of structural deficit. Stocks have declined by 762 million ounces since 2021, increasing the risk of renewed liquidity constraints. The global silver deficit is projected to widen to 46.3 million ounces in 2026 from 40.3 million ounces in 2025, despite total demand expected to decline 2%. Industrial fabrication is forecast to fall 3% to a four-year low amid weaker economic growth expectations, while coin and bar demand is projected to rise 18%, supported by stronger U.S. investment demand. Global silver supply is expected to decline 2% as producer hedging normalises. Chinese imports of silver-bearing ores surged 62.5% year-on-year to 219,000 tonnes in June, highlighting continued industrial activity. London vault holdings increased 1.7% month-on-month to 28,082 tonnes at end-June, valued at $53.1 billion. Citi maintained a bullish outlook, targeting $75 per ounce over three months and $90 over six to 12 months, supported by stronger investment demand and expectations of a less hawkish Federal Reserve. Technically, silver remains under long liquidation, with open interest falling 10.17% to 8,201 while prices declined Rs93. Immediate support is placed at Rs241,645, followed by Rs239,170, while resistance is seen at Rs245,655 and Rs247,190. A break below Rs241,645 could extend the corrective phase, while sustained movement above Rs245,655 may revive bullish momentum toward Rs247,190.
Trading Ideas:
* Silver trading range for the day is 239170-247190.
* Silver fell as dollar index steadied near 99 supported by safe-haven demand as the US moved to cut Iran off from the global financial system.
* Treasury Secretary Scott Bessent announced plans on Monday to isolate Iran through sanctions targeting countries doing business with the Islamic Republic.
* Markets speculated that the plan may offer only a temporary solution, while renewing concerns over the risks of a US debt crisis and dollar weakness.
Crude oil
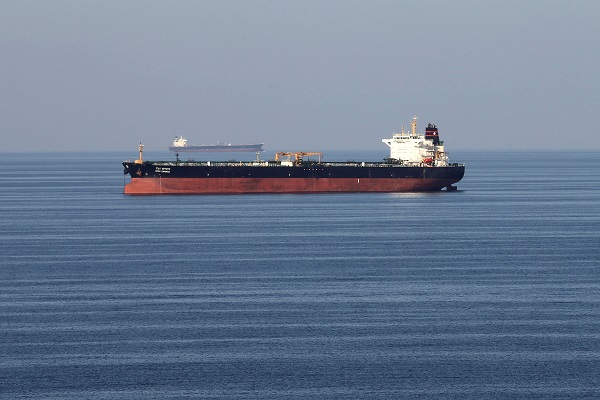
Crude oil settled sharply lower by 3.66% at Rs7,837 as intensified U.S. economic pressure on Iran and its trading partners raised uncertainty over the timing of a potential resolution to the conflict and the reopening of the Strait of Hormuz. U.S. Treasury Secretary Scott Bessent announced sanctions targeting countries continuing business with Iran, while President Donald Trump indicated that nations would face a deadline to sever ties with Tehran or risk unilateral penalties. Despite the decline, geopolitical risks remain elevated after an oil tanker was reportedly struck near Oman and Houthi militants claimed an attack on a Saudi supertanker in the Red Sea. Morgan Stanley expects a prolonged Middle East supply recovery and forecasts Brent at $90 per barrel in Q3 2026, rising to $100 in Q4, before easing to $95 in Q1 2027 and $90 in Q2 2027. Saudi crude exports increased to 3.993 million barrels per day in June from 3.434 million bpd in May, according to JODI data. Meanwhile, U.S. crude inventories rose 4.4 million barrels to 428.8 million barrels, while Cushing stocks declined 1.3 million barrels. Gasoline inventories increased 0.7 million barrels to 209.4 million, whereas distillate stocks fell 1.5 million barrels to 105.6 million barrels. Refinery runs increased by 216,000 bpd, with utilization rising one percentage point. The CFTC showed net long oil positions jumping 23% to 122.1K contracts, indicating stronger bullish positioning. OPEC lowered its 2026 oil demand growth forecast to 580,000 bpd, marking its fourth consecutive downward revision, although it raised its 2027 growth outlook. Technically, crude oil remains under long liquidation, with open interest declining 3.3% to 11,320 while prices fell Rs298. Immediate support is placed at Rs7,681, followed by Rs7,525, while resistance is seen at Rs8,094 and Rs8,351. A sustained break below Rs7,681 could extend the correction toward Rs7,525, while a move above Rs8,094 may revive buying interest toward Rs8,351.
Trading Ideas:
* Crudeoil trading range for the day is 7525-8351.
* Crude oil fell as the US intensified economic pressure on Iran and its trading partners.
* Morgan Stanley bank forecasts Brent oil at $90 per barrel in the Q3 2026, $100 in Q4 2026, $95 in Q1 2027 and $90 in Q2 2027.
* Commodity vessel transits through Strait of Hormuz hit three-month low, data shows
Natural gas
Natural gas settled lower by 0.49% at Rs265.1 as record production and above-average inventories continued to weigh on prices, although cooling demand and lower-than-expected storage injections provided some support. Lower 48 production averaged a record 111.5 bcfd in August, up from 110.7 bcfd in July, while inventories remained 6.7% above the five-year seasonal average. Gas flows to the nine major LNG export facilities eased slightly to 17.1 bcfd from 17.2 bcfd in July, leaving additional supplies available for domestic consumption. Cheniere Energy’s Corpus Christi LNG facility also continued to show lower gas intake amid ongoing maintenance. Weather forecasts turned slightly cooler, but above-normal temperatures are still expected across Texas and the Southwest through September 7, keeping cooling-related demand elevated. U.S. energy firms added 16 bcf to storage for the week ended August 14, below market expectations of 19 bcf and well below the five-year average injection of 29 bcf. Total inventories rose to 3.169 trillion cubic feet, 0.9% below last year but 6.2% above the five-year average. The EIA expects U.S. dry gas production to increase from 107.6 bcfd in 2025 to 111.2 bcfd in 2026 and 116.0 bcfd in 2027, while domestic consumption is projected to rise from 91.9 bcfd to 92.0 bcfd and 94.8 bcfd, respectively. LNG exports are forecast to increase to 17.4 bcfd in 2026 and 18.6 bcfd in 2027, although maintenance at Freeport LNG has slightly reduced the 2026 outlook. Technically, natural gas remains under long liquidation, with open interest declining sharply by 42.23% to 9,976 while prices fell Rs1.3. Immediate support is placed at Rs260.1, followed by Rs255.2, while resistance is seen at Rs267.9 and Rs270.8. A sustained break below Rs260.1 could extend weakness toward Rs255.2, whereas a move above Rs267.9 may trigger recovery toward Rs270.8.
Trading Ideas:
* Naturalgas trading range for the day is 255.2-270.8.
* Natural gas prices fell as strong production and ample inventories weighed on the market.
* Output in the Lower 48 states averaged a record 111.5 bcfd in August so far, up from 110.7 bcfd in July.
* Gas inventories are 6.7% above their five-year seasonal average.
Copper
Copper settled higher by 0.31% at Rs1,388.45, supported by a June global refined copper deficit and a constructive longer-term supply outlook, although the sharp rise in exchange inventories capped gains by easing concerns over immediate supply tightness. The International Copper Study Group reported a 60,000-tonne refined copper deficit in June, compared with a 15,000-tonne surplus in May, as global output reached 2.37 million tonnes against consumption of 2.43 million tonnes. However, the market remained in a 131,000-tonne surplus during January-June 2026, compared with a 114,000-tonne surplus in the same period last year. LME-monitored inventories stood at 238,575 tonnes, around 16% above the August 14 level, while SHFE stocks jumped 28.4% last week to 89,548 tonnes. Comex inventories remained at a record 742,778 short tons, while the LME cash premium over three-month copper narrowed sharply to around $53 per tonne from $545 a week earlier, indicating improved nearby availability. China’s refined copper imports declined 11.5% year-on-year to 425,000 tonnes in July, while January-July imports fell 6.2% to 2.92 million tonnes. Chinese copper ore and concentrate imports declined 7.1% year-on-year in July to 2.38 million tonnes, while domestic refined copper production increased 1.3% to 1.29 million tonnes. In contrast, U.S. importers brought in more than 200,000 tonnes of refined copper in July, the highest monthly volume in at least 12 years. UBS expects the copper deficit to widen to 379,000 tonnes in 2027 from 219,000 tonnes in 2026 and maintains a price target of $15,500 per tonne. Technically, copper is under short covering, with open interest declining 23.7% to 4,482 while prices gained Rs4.30. Support is placed at Rs1,381.60 and Rs1,374.60, while resistance is seen at Rs1,393 and Rs1,397.40. A sustained move above Rs1,393 could strengthen the upside toward Rs1,397.40, while failure to hold Rs1,381.60 may trigger corrective pressure toward Rs1,374.60.
Trading Ideas:
* Copper trading range for the day is 1374.6-1397.4.
* Copper gained as global refined copper market showed a 60,000 metric tons deficit in June.
* LME-monitored copper inventories stood at 238,575 tons, about 16% above their February low.
* Comex copper stocks stand at record highs of 742,778 short tons, or 673,836 metric tons.
Zinc
Zinc settled sharply higher by 3.05% at Rs424.7, supported by tightening supplies outside China, declining LME inventories and concerns over potential production disruptions in China. LME zinc stocks fell 25% since mid-June to 93,250 tonnes, while the premium of LME cash zinc over three-month zinc surged to $132 per tonne from zero in early July, reaching its highest level since December. Heavy rainfall and flooding in parts of China are threatening mining and smelting operations, with production adjustments at a Southwest China mine expected to reduce August concentrate output by around 1,000 tonnes, while maintenance at a Central China smelter could cut refined production by 1,000–1,500 tonnes. Global supply has also weakened, with Glencore reporting first-half own-sourced zinc production down 21% year-on-year to 365,600 tonnes, while Boliden’s zinc concentrate output fell 16.8% quarter-on-quarter to 74,200 tonnes. Nexa reported second-quarter zinc production of 79.3 kt, up 8% year-on-year, while Minmetals Resources produced 105,800 tonnes and maintained its full-year guidance of 215,000–235,000 tonnes. The global refined zinc surplus narrowed sharply to 8,700 tonnes in May from 43,400 tonnes in April, although the January-May surplus stood at 163,000 tonnes compared with 44,000 tonnes a year earlier. China’s refined zinc output rose 10% year-on-year to 641,000 tonnes in May, indicating strong smelter operations and limiting the upside. Elevated prices have also started to weaken demand, particularly among Chinese buyers. Technically, zinc is under short covering, with open interest declining 23.67% to 1,409 while prices gained Rs12.55. Immediate support is placed at Rs414.5, followed by Rs404.2, while resistance is seen at Rs430.8 and Rs436.8. A sustained move above Rs430.8 could extend the rally toward Rs436.8, while a break below Rs414.5 may trigger profit-taking toward Rs404.2.
Trading Ideas:
* Zinc trading range for the day is 404.2-436.8.
* Zinc prices rose on concern about shortages outside China.
* LME zinc stocks at 93,250 tons have dropped 25% since the middle of June.
* Stocks of the metal in warehouses approved by the Shanghai Futures Exchange have more than doubled this year.
Aluminium
Aluminium settled higher by 0.71% at Rs348.9, supported by China’s pledge of fiscal measures to strengthen economic growth and a weaker dollar, while expectations of additional policy support increased following China’s Q2 GDP growth slowdown to 4.3%. Japanese aluminium inventories at three major ports declined 8.8% month-on-month to 201,000 tonnes at end-July, partly due to reduced Middle East supplies amid the Iran conflict. However, gains were capped by expectations of faster production restarts in the Middle East and alternative shipping routes being used to minimise supply disruptions. EGA and Alba are accelerating production recovery, while Emirates Global Aluminium said its Al Taweelah smelter was operating at 18% capacity and is expected to return to previous output levels in early 2027. China’s aluminium production increased 3.8% year-on-year to 3.9 million tonnes in July, while exports of unwrought aluminium and semis rose 18.6% year-on-year to 643,000 tonnes, although they declined 9.6% month-on-month. January-July exports reached 4.04 million tonnes, up 16.7% year-on-year. Global primary aluminium output declined 1.7% year-on-year to 6.16 million tonnes in July, with Gulf production plunging 44% to 293,000 tonnes following disruptions caused by the Iran conflict. China’s output rose 2.7% year-on-year to 3.866 million tonnes, partly offsetting the Gulf decline. Supply concerns also persisted after Norsk Hydro reduced alumina output at Alunorte to 50% of capacity due to lower natural gas availability, while Alcoa cut its 2026 alumina production guidance by 200,000–300,000 tonnes to 9.5–9.6 million tonnes. Technically, aluminium is under short covering, with open interest declining 21.99% to 1,490 while prices gained Rs2.45. Immediate support is placed at Rs345.8, followed by Rs342.7, while resistance is seen at Rs350.9 and Rs352.9. A sustained move above Rs350.9 could extend gains toward Rs352.9, whereas a break below Rs345.8 may trigger corrective pressure toward Rs342.7.
Trading Ideas:
* Aluminium trading range for the day is 342.7-352.9.
* Aluminium gains supported by China pledging fiscal policy measures to strengthen economic growth.
* Aluminium stocks at three major Japanese ports fell to 201,000 metric tons at the end of July, down 8.8% from the previous month.
* Global primary aluminium output in July fell 1.7% year on year to 6.16 million tonnes – IAI
Turmeric
Turmeric settled sharply lower by 5.73% at Rs20,494 as profit booking intensified after the revival of monsoon activity across Maharashtra, Telangana and North Karnataka eased concerns over dry weather and potential crop losses. Improved rainfall and the filling of key reservoirs in Telangana and Andhra Pradesh have ensured better water availability during the vegetative phase, while re-sowing in North Karnataka has been completed following improved precipitation. However, downside remains limited by structurally tight supplies, reduced carry-forward stocks and concerns over the impact of El Nino on the newly sown crop. Turmeric acreage is expected to increase 16.05% year-on-year from 2025 and remain above the five-year average of 1.88 lakh hectares, although traders are monitoring whether improved weather conditions translate into sustained production gains. Carry-forward stocks are estimated at around 15 lakh bags, down from more than 20 lakh bags last season, reducing the availability buffer. Farmer selling during the peak harvest period has increased near-term supply pressure, while stockists remain cautious. European Union Maximum Residue Limit regulations have led to rejection of non-IPM compliant lots, discounting commercial-grade turmeric, although growing demand for IPM-certified turmeric is supporting compliant stocks. Export demand remains strong, with June exports rising 30% year-on-year to 17,987 tonnes, while April-June exports increased 8% to 51,987 tonnes. China shipments surged 2,710% cumulatively to 2,108 tonnes, while exports to Oman increased 469% to 2,342 tonnes. Nigeria, Sri Lanka and Uruguay also recorded strong growth. In Nizamabad, spot turmeric fell 2.48% to Rs19,957.4. Technically, the market remains under long liquidation, with open interest declining 2.35% to 35,910 while prices fell Rs1,246. Immediate support is placed at Rs20,010, followed by Rs19,526, while resistance is seen at Rs21,404 and Rs22,314. A sustained break below Rs20,010 could extend weakness toward Rs19,526, whereas a move above Rs21,404 may revive buying interest toward Rs22,314.
Trading Ideas:
* Turmeric trading range for the day is 19526-22314.
* Turmeric dropped on profit booking as revival of monsoon activity eased dry-weather fears.
* Filling up of key reservoirs in Telangana and Andhra Pradesh ensured reliable water supply for the vegetative phase, dampening crop failure speculation.
* Tighter European Union regulations on Maximum Residue Limits (MRLs) led to rejections of non-IPM compliant lots, discounting commercial-grade turmeric prices.
* In Nizamabad, a major spot market, the price ended at 19957.4 Rupees dropped by -2.48 percent.
Jeera
Jeera settled higher by 0.41% at Rs20,920, supported by tightening availability of premium-quality bold seeds as arrivals across major markets such as Unjha and Rajasthan have started to taper. Although overall physical availability remains stable, supplies of export-grade, high-purity bold seeds are declining faster than expected, while blight outbreaks in key Gujarat producing areas have affected both crop quality and harvestable volumes. However, upside remains capped as farmers are actively liquidating stocks to generate cash flow for Kharif sowing, while favourable weather allowed faster harvesting and drying. Rising NCDEX warehouse stocks have reduced the urgency for spot procurement, with large spice grinders adopting a cautious approach and limiting bulk purchases. Domestic processors and stockists are also following hand-to-mouth buying, while improved production prospects in Turkey and Syria are weighing on Indian export premiums. Nevertheless, European and North American buyers have returned for residue-compliant and high-specification lots. Domestic jeera production is estimated at 90–92 lakh bags this season, down from 1.10 crore bags last year, with Gujarat production estimated at 42–45 lakh bags and Rajasthan at 48–50 lakh bags. China production is estimated at 70–80 thousand tonnes due to adverse weather, while Syria, Turkey and Afghanistan are expected to produce around 9–10 thousand, 10–11 thousand and 10–12 thousand tonnes, respectively. India’s jeera exports declined 34% year-on-year to 10,713 tonnes in June, while April-June exports fell 25% to 44,144 tonnes. Singapore, Oman and Argentina recorded strong growth, but these gains were insufficient to offset the broader export decline. In Unjha, spot prices fell 0.32% to Rs20,590.85. Technically, jeera is under short covering, with open interest declining 3.01% to 8,904 while prices gained Rs85. Support is placed at Rs20,820, followed by Rs20,710, while resistance is seen at Rs21,070 and Rs21,210. A sustained move above Rs21,070 could extend gains toward Rs21,210, while a break below Rs20,820 may trigger weakness toward Rs20,710.
Trading Ideas:
* Jeera trading range for the day is 20710-21210.
* Jeera gains amid a rapid tightening in the supply of premium-quality bold seeds.
* While total physical crop availability is stable, the export-grade high-purity bold seed supply is shrinking much faster than anticipated.
* Geopolitical instability in the Middle East continues to dampen logistics and demand from key traditional buyers.
* In Unjha, a major spot market, the price ended at 20590.85 Rupees dropped by -0.32 percent.
Views express by all participants are for information & academic purpose only. Kindly read disclaimer before referring below views