West Asia crisis: Europe`s resilience up, but energy price risks persist by CareEdge Ratings
Executive summary
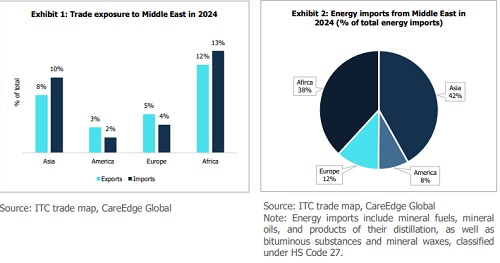
Although limited domestic production keeps Europe strongly dependent on imported energy, the West Asia crisis, which began in late February 2026, poses a limited direct trade and energy supply risk to Europe because of low dependence on Middle East. The Middle East accounts for only 4% of Europe’s total imports, 5% of its exports, and 12% of energy imports (see Exhibits 1 and 2).
Unlike the 2022 Russia-Ukraine crisis, which majorly disrupted energy supplies to Europe, the current conflict is driving up energy prices without cutting off supply. Europe remains largely insulated from direct energy supply disruption thanks to diversified and stable sourcing partners.
Europe is structurally stronger today due to better supplier diversification, reduced fossil fuel dependence, increased green investments, and improved policies. However, its transition is incomplete. The continent remains exposed to global energy price shocks, with net energy imports exceeding domestic production (energy imports equal 103% of domestic production) and reliance on spot LNG (43.7% of total LNG supply).
Despite low direct reliance on trade and energy from the Middle East, higher global oil and gas prices continue to spill into the economy, keeping inflation risks elevated. Higher energy prices are pushing up inflation, reducing people’s purchasing power, and slowing consumer spending and economic growth. Conversely, risks to government finances remain limited, as authorities have introduced only modest support measures and are expected to continue this cautious approach. While inflation remains a concern, a recent easing in oil prices lowers the probability of further policy rate increases, following the European Central Bank’s (ECB) 25-basis points rate hike in June.
The impact across Europe appears uneven. Türkiye, Cyprus and Greece are most exposed due to high energy dependence, persistent current account deficits, and weaker fiscal profiles. Sweden and France are the least exposed because of lower dependence on energy imports.
West Asia crisis: Europe’s resilience up, but energy price risks persist
Key takeaways
• Under the current assumption of Brent crude averaging USD 82 per barrel, Europe’s GDP growth is projected to slow to 1.3% in 2026 from the pre-crisis forecast of 1.5%, as higher energy costs and geopolitical uncertainty weigh on economic activity. Under a downside scenario, growth is projected to ease to 1.2% if Brent averages USD 95 per barrel and to 1.1% at USD 105 per barrel (Appendix Table 1).
• Headline inflation (excluding Türkiye) is expected to jump to 2.6% in 2026 vs the previous projection of 2.0% as per the IMF’s WEO October 2025 update. A more severe or prolonged disruption may push headline inflation (excluding Türkiye) close to 2.9% with Brent crude oil price averaging USD 95 per barrel and further to 3.1% if Brent crude oil price averages USD 105 per barrel, significantly raising risks, especially in highly energy?dependent economies with limited fiscal flexibility (Appendix Table 2).
• ECB: Probability of further rate hikes has decreased slightly after the US-Iran deal but remains moderate because inflation is still above target and the ECB is open to further tightening. • Bank of England (BoE): Probability of hike is lower than for the ECB, because inflation was stable in April and May, as well as lower than before the West Asia crisis, with a base case of hold.
This time it’s different
The overall impact so far is significantly more contained than during the 2022 energy crisis. That episode was triggered by a gradual tightening and eventual collapse of Russian gas supplies at a time when Europe was highly dependent on pipeline gas imports and lacked immediate alternatives.
The resulting structural shock required a broad and rapid overhaul of Europe’s energy system, including scaling up LNG capacity, securing new supply contracts, and reconfiguring infrastructure. In contrast, the current disruption is primarily linked to disruptions in shipping lanes and energy exports from the Gulf. While these factors can influence global energy markets and create a spillover effect for Europe, the underlying exposure is lower and more diversified.
Thus, Europe’s exposure to risks arising from the West Asia crisis is expected to be manageable, supported by limited direct trade links with the region, diversified energy suppliers, reduced fossil fuel dependence, and policy support measures, as outlined below.
a) Limited direct trade and energy exposure to the region
Imports from the Middle East account for just 4% of total imports, while exports to the region represent 5% of total exports. Importantly, a meaningful share of this trade does not transit through the Strait, reducing immediate vulnerability (Exhibit 1).
The Middle East supplies around 12% of Europe’s energy imports, significantly lower than Asia (42%) and Africa (38%) (Exhibit 2). Notably, Saudi Arabia and the UAE, which together account for roughly 50% of these imports, have alternative pipeline infrastructure that bypasses Hormuz. Iraq, contributing about 20%, is increasingly exporting crude via land routes through Syria. However, these alternatives are not frictionless. Pipeline and land-route capacities are limited, and transportation costs are higher versus traditional sea routes.
b) Diversified energy suppliers
While Europe is heavily reliant on energy imports, its energy security has improved through greater diversification of suppliers. The US now accounts for around 16% of the European Union’s oil imports and more than half of its LNG imports, while Norway supplies about 14% of oil imports and over 50% of pipeline gas imports.
c) Reduced fossil fuel dependence
Europe has expanded its renewable and nuclear energy capacity. These sources now account for roughly 33% of its energy mix, well above Asia (11%) and Africa (5.5%), reducing its vulnerability to fossil fuel shocks.
d) Better policy support
Europe’s resilience to the West Asia crisis has been strengthened by proactive policy support aimed at reducing energy dependence and accelerating the green transition. The Recovery and Resilience Facility (RRF) requires member states to allocate at least 37% of funding to climate-related measures. In practice, the average climate allocation has exceeded 40%, translating into around €235 billion of climate expenditure, including over €153 billion for energy-related investments.
Complementing this, the REPowerEU plan is expected to mobilise an additional €210 billion by 2027 to accelerate renewable energy deployment, strengthen electricity grids, improve energy efficiency, and diversify energy supplies. Implementation of reforms is on track due to the RRF’s performance-based framework, which links disbursements to the achievement of agreed targets. As a result, Europe has expanded its renewable energy capacity, strengthened energy security and reduced vulnerability to external energy shocks and geopolitical disruptions.
Energy price exposure remains
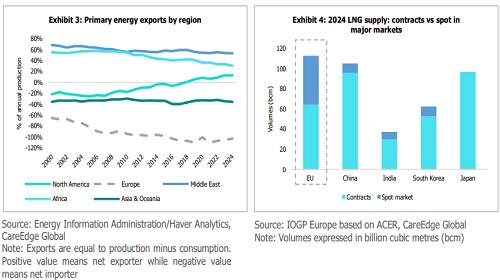
Europe remains strongly dependent on imported energy because of limited domestic production. In fact, its energy imports are higher than its total production, at ~103% of production (Exhibit 3).
Europe also has a higher share of LNG imports linked to the spot market compared with other major economies. In 2024, around 43.7% of the EU’s LNG supply was sourced through the spot market, significantly higher than Japan (0%), China (8.6%), South Korea (15.8%), and India (20.4%) (Exhibit 4).
As a result, Europe is highly sensitive to global energy market developments. Any disruption or geopolitical tension in major producing regions quickly pushes up energy prices for households and businesses. Even without actual supply shortages, prices can rise due to expectations, tight market conditions, and higher risk premiums.
Higher energy price implications
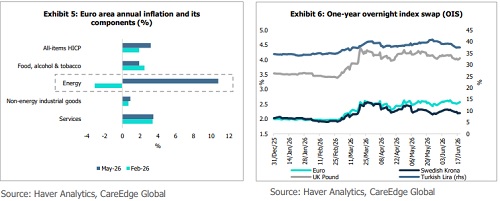
* Higher energy prices are pushing up inflation in Europe, both directly through energy costs and indirectly by increasing production costs across the supply chain. This impact is already visible in recent data. Euroarea inflation rose to 3.2% in May from 1.9% in February, due to higher energy prices (Exhibit 5).
* Inflation expectations have also increased sharply, with median 12?month expectations rising to 4.0% in April 2026 from 2.5% in February, reaching the highest level since October 2023. These pressures are building at a time when demand is weakening, increasing the risk of stagflation-like conditions if energy prices rise beyond adverse scenarios.
* Renewed energy?driven inflation has shifted monetary policy towards a more restrictive stance, with overnight interest spreads (OIS) higher than pre-war levels (Exhibit 6). Probability of rate hike has declined with the US-Iran peace deal in place. However, inflation is still above the target rate.
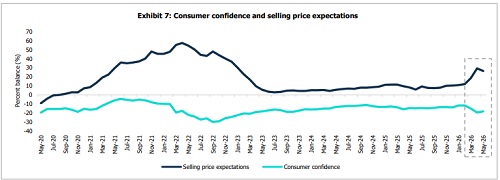
* Elevated energy costs reduce the cost competitiveness of European exports, while increasing the cost of non?oil imports. Pricing pressures on the supply-side remain strong, as shown by the EU manufacturers’ selling price expectations index, which rose sharply to 26.4 in May from 11.5 in February, driven by higher energy costs (Exhibit 7).
* For households, persistent inflation erodes real income and limits spending. After supporting growth in 2025, consumer spending in Europe is expected to slow in 2026, as higher inflation and uncertainty weigh on incomes. This trend is already visible in declining consumer confidence, which fell in both March and April (Exhibit 7).
Overall, higher energy prices will push inflation higher and put pressure on growth and fiscal metrics, but the magnitude of impact depends on the policy mix during the crisis. Moreover, the higher imported energy bills will adversely impact the current account balance (see Appendix).
Above views are of the author and not of the website kindly read disclaimer