Weekly Technical Market Outlook 21-02-2025 by Jainam Share Consultants

Nifty
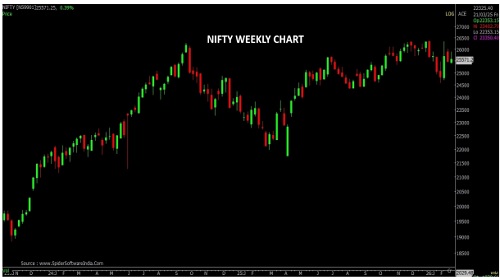
* Nifty opened the week at made a open of 25,423.60 high of 25,885.30 lowtheweekat25,372.70 and week close at 25,571.25. Thus, Nifty closed the week with a gainof 100.15pointson weekly basis.
* On the weekly chart, Nifty started the week on a positive note and witnessedsellingpressurefrom the higher level and from a bullish candle with long uper showed. The overall tradingrangefor index for coming week would be 26000.00 - 25400.00, either side breakout will leadthetrend.
* The Nifty opened with a downward gap but saw buying interest at lower levels, resultinginarecovery during the session. It formed a bullish candle with an upper shadow, indicatingsomeresistance at higher levels. The RSI is currently at 48.35, suggesting neutral momentumwithamildpositive bias.The chart pattern suggests that, If Nifty crosses and sustains above25600levelitwould witness buying which would lead the index towards 25800 -25850 levels. Howeverifindexbreaks below 25400 level it would witness selling which would take the index towards25300-25100
Bank Nifty
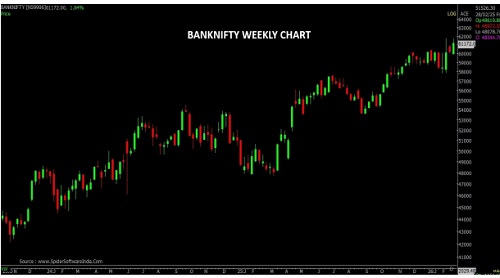
* Banknifty opened the week at 59,947.80 made a high of 61,678.80 lowof 59,861.10andclosedthe week at 61,172.00. Thus, Banknifty close the week with a gain of 985.35 pointsonweeklybasis.
* Bank Nifty started the week on a flat note but witnessed buying interest at lower levels, engulfingthe previous week’s candle and closing above its high. The overall trading range for Bankniftywould be 61,200- 59,800 either side breakout will lead the trend.
* The Bank Nifty index opened with a downward gap but witnessed buying interest at lowerlevels,resulting in a recovery during the session. It formed a bullish candle with anupper shadow,indicating some resistance at higher levels. The index is trading above all its movingaverages,andthe RSI is currently at 58.93, suggesting moderately bullish momentum. If Bankniftycrossesandsustains above 61,600 level it would witness buying which would lead the index towards62,000-62,400 levels. However if index breaks below 60,400 level it would witness sellingwhichwouldtake the index towards 59,800- 59,500.
* Support : 61,600 - 62,000 - 62,400
* Resistance : 60,400 - 59,800 - 59,500
Sensex
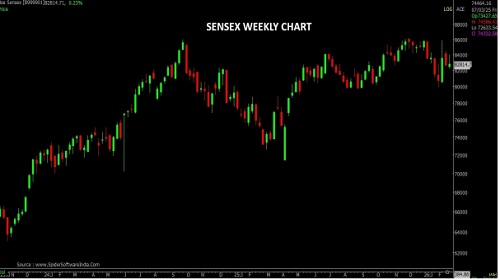
* Sensex opened the week at 82,480.40 made a high of 83,979.36 low of 82,206.21andclosetheweek at 82,814.71. Thus, Sensex close the week with a gain of 187.95 points on weeklybasis.
* On the weekly chart,Sensex started the week on a positive note and witnessedsellingpressurefrom the higher level and from a bullish candle with long uper showed. The overall tradingrangefor Banknifty would be 84,200- 82,200either side breakout will lead the trend.
* The Sensex opened with a downward gap but saw buying interest at lower levels, resultinginarecovery during the session. It formed a bullish candlestick with an upper shadow, indicatingsomeresistance at higher levels. The RSI is currently at 49.36, suggesting neutral momentumwithamildpositive bias . The chart pattern suggests that, If Sensex crosses and sustains above83,200levelitwould witness buying which would lead the index towards 83,900- 84,500 levels. Howeverifindexbreaks below 82,200 level it would witness selling which would take the index toward81,600-81,700.
* Support : 83,200- 83,900- 84,500
* Resistance : 82,200- 81,600- 81,700
Please refer disclaimer at https://jainam.in/
SEBI Registration No.: INZ000198735, Research Analyst: INH000006448, PMS: INP000006785