Turmeric trading range for the day is 12940-13368 - Kedia Advisory

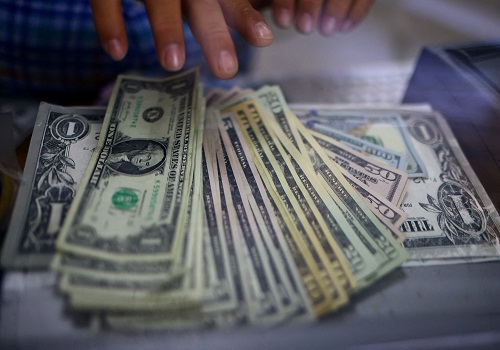
Gold
Gold settled slightly lower by -0.02% at 86,010 as profit booking weighed on prices after recent gains driven by concerns over U.S. President Donald Trump's tariff threats and rising inflationary risks. Expectations that Trump’s protectionist stance could fuel inflation are providing a long-term bullish outlook for bullion. Meanwhile, geopolitical tensions between Russia and Ukraine remain unresolved, with Ukrainian drone attacks on Russian oil infrastructure further adding to safe-haven demand. China's gold market showed improvement in January, with the People's Bank of China (PBoC) purchasing gold for the third consecutive month, lifting total official holdings to 2,285 metric tons, accounting for 5.9% of total foreign reserves. However, physical demand in key consuming nations like China and India remains subdued due to record-high prices. Indian dealers offered discounts of up to $35 per ounce over official domestic prices, up from $26 last week, while in China, discounts ranged from $1 to $3 per ounce. Additionally, Swiss gold exports to India and China saw sharp declines, plunging 88% and 99%, respectively, on an annual basis. Goldman Sachs revised its year-end 2025 gold price forecast upward to $3,100 per ounce from $2,890, citing structurally higher central bank demand. Technically, the market is witnessing fresh selling, with open interest rising by 1.68% to 16,263 contracts. Gold is finding support at 85,635, and a break below this level could test 85,260. On the upside, resistance is at 86,220, with a move above potentially pushing prices to 86,430.
Trading Ideas:
* Gold trading range for the day is 85260-86430.
* Gold dropped on profit booking after price rose amid lingering concerns over U.S. tariff threats.
* Furthermore, expectations that Trump's protectionist policies would reignite inflation could act as a tailwind for the bullion.
* China’s domestic gold market improved in some areas in January with the central bank purchasing third straight month.
Silver
Silver declined by -0.94% to settle at 96,200 due to profit booking after recent gains driven by concerns over U.S. President Donald Trump’s aggressive tariff plans. The latest round of tariffs includes duties on lumber, forest products, cars, semiconductors, and pharmaceuticals, adding to previous levies on Chinese imports and steel and aluminum. These policies are seen as inflationary, keeping market participants cautious about the Federal Reserve’s rate trajectory. Fed officials remain hesitant about rate cuts due to persistent inflation risks, with St. Louis Fed President Alberto Musalem warning about potential stagflation. Meanwhile, Atlanta Fed President Raphael Bostic hinted at possible rate cuts later this year, depending on economic conditions. Despite price volatility, the silver market is expected to remain in deficit for the fifth consecutive year in 2025, with a shortfall of 149 million ounces. Global silver demand is projected to stay stable at 1.20 billion ounces, with industrial fabrication forecasted to grow by 3% to over 700 million ounces. The rise in demand is primarily driven by green economy applications and industrial usage, although jewelry and silverware demand is expected to decline by 6%, particularly in India due to high local prices. Technically, the silver market is undergoing long liquidation, with open interest dropping by 10.14% to 16,397 contracts. Silver finds support at 95,710, with further downside potential to 95,220. Resistance is seen at 96,885, and a move above could push prices toward 97,570.
Trading Ideas:
* Silver trading range for the day is 95220-97570.
* Silver dropped on profit booking after prices rose amid concerns about U.S. President Trump's tariff plans.
* Market participants are monitoring the Fed’s interest rate trajectory due to Trump's perceived inflationary policies.
* Fed officials are wary of future interest rate cuts due to persistent inflation.
Crude Oil
Crude oil prices declined by -2.66% to settle at 6,148, driven by a larger-than-expected build in U.S. crude stockpiles and investor concerns over potential economic impacts from trade tariffs. The U.S. Energy Information Administration (EIA) reported a crude inventory increase of 4.633 million barrels for the week ending February 14, surpassing market expectations of a 3 million-barrel build. Additionally, stockpiles at Cushing, Oklahoma, rose by 1.472 million barrels, marking the highest increase since May 2024. However, gasoline stocks saw a slight decline of 0.151 million barrels, while distillate inventories fell more sharply by 2.051 million barrels, exceeding consensus estimates. Despite the bearish stock data, supply concerns offered some support to prices. A Ukrainian drone attack disrupted Russia’s Caspian Pipeline Consortium, cutting oil flows by 30%-40%. Additionally, geopolitical tensions between Ukraine and the U.S. intensified after Donald Trump’s remarks about Ukrainian President Zelensky. Meanwhile, U.S. oil imports from Mexico hit a record low of 149,000 barrels per day, reflecting shifts in trade patterns. The EIA revised its crude production forecast upward, now expecting U.S. output to reach 13.59 million barrels per day in 2025, up from 13.55 million bpd previously estimated. Technically, crude oil is experiencing fresh selling pressure, with open interest rising by 11.46% to 3,852 contracts. The market is finding support at 6,089, with further downside potential to 6,031. Resistance is now seen at 6,252, and a move above this level could push prices toward 6,357.
Trading Ideas:
* Crudeoil trading range for the day is 6031-6357.
* Crude oil dropped after an industry report showed a build in U.S. crude stockpiles and as tariff concerns weighed on sentiment.
* However downside seen limited driven by concerns over supply disruptions in Russia and improving demand outlook.
* Russia reported a 30%-40% reduction in Caspian Pipeline Consortium oil flows after a Ukrainian drone attack on a pumping station.
Natural Gas
Natural gas prices surged by 5.16% to settle at 371 as cold weather strained supply and boosted demand. The Arctic blast significantly increased heating demand while freezing oil and gas wells, leading to production disruptions. Colder-than-normal temperatures are expected to persist across the Lower 48 states until at least February 22, keeping consumption elevated. Production has also been impacted, with output falling by 6.7 bcfd over the past 15 days to a four-week low of 100 bcfd on Thursday. Adding to supply constraints, gas flows to LNG export plants hit record levels, averaging 15.5 bcfd in February, up from 14.6 bcfd in January. A new daily LNG feedgas record of 16.4 bcfd was set on Wednesday, surpassing the previous day’s 16.2 bcfd. The U.S. Energy Information Administration (EIA) reported a larger-than-expected storage withdrawal of 196 bcf for the week ending February 14, reducing total inventories to 2,101 bcf. The steepest declines were recorded in the Midwest (-65 bcf), South Central (-54 bcf), and East (-39 bcf). Storage levels are now 15.5% lower than last year and 5.3% below the five-year average, signaling a tighter market. Looking ahead, the EIA projects both production and demand will reach record highs in 2025, with dry gas output forecasted to rise to 104.6 bcfd and consumption to 90.7 bcfd. Technically, the market is witnessing fresh buying, with open interest increasing by 14.16% to 11,382. Support is seen at 358.9, with further downside potential to 346.7, while resistance is likely at 383.9, with a breakout potentially pushing prices to 396.7.
Trading Ideas:
* Naturalgas trading range for the day is 346.7-396.7.
* Natural gas rose as cold weather strained supply and boosted demand.
* Prices surged as an Arctic blast boosted heating demand while freezing oil and gas wells, disrupting production.
* Forecasts indicate colder-than-normal temperatures across the Lower 48 states through February 22, keeping consumption high.
Copper
Copper prices declined by 0.49% to settle at 865.5 as market sentiment weakened due to concerns over demand following U.S. President Donald Trump’s threats to impose tariffs on cars and semiconductor chips. Investors are also closely monitoring China’s National People’s Congress meeting in March for potential stimulus measures amid ongoing trade tensions and sluggish demand. Copper inventories in Shanghai Futures Exchange warehouses increased by 12.9% from last Friday, indicating a build-up in supply. Meanwhile, market dynamics remain volatile, with the spread between cash LME copper and benchmark three-month futures swinging sharply. After reaching a premium of $249 per ton, the spread flipped to a discount of $50 on Monday. Additionally, the premium of COMEX copper over LME copper widened to $1,002 per ton from $913, reflecting shifting market preferences. In Peru, the world’s second-largest copper producer, output in 2024 declined by 0.7% to 2,736,150 metric tons, marking the first annual drop after four years of recovery. Production is expected to stabilize at around 2.8 million tons in 2024 and 2025 due to lower ore grades and the absence of new projects. On the supply side, the global refined copper market showed a 131,000 metric ton deficit in November, up from a 30,000 metric ton deficit in October, as consumption exceeded production. Technically, the market is experiencing long liquidation, with open interest dropping by 30.22% to 2,168. Support is seen at 861.6, with further downside potential to 857.5, while resistance is at 870.4, and a breakout above could push prices to 875.1.
Trading Ideas:
* Copper trading range for the day is 857.5-875.1.
* Copper eased after U.S. President Donald Trump threatened to impose tariffs on cars and semiconductors chips.
* Shanghai warehouse copper stocks up 12.9%
* China's central bank vowed to provide strong financial support for the healthy development of private economy.
Zinc
Zinc prices edged up by 0.11% to settle at 271.85, supported by expectations of monetary easing from the People's Bank of China (PBoC). The central bank acknowledged external economic challenges and weak domestic demand, signaling its intent to adjust policies using interest rates and reserve requirements to stabilize growth. In line with this, new bank loans in China surged to a record high in January, reinforcing expectations of further stimulus measures. Despite these positive signals, concerns linger over the potential impact of U.S. President Donald Trump's renewed tariff threats. However, Trump also hinted at the possibility of a new trade deal with China, fostering some optimism regarding U.S.-China relations. Meanwhile, zinc inventories in Shanghai Futures Exchange warehouses rose by 26.3% last week, reflecting an increase in available supply. On the production side, global mined zinc output declined for the third consecutive year in 2024, aligning with a 7% drop in China’s refined zinc output due to lower processing rates. Additionally, China’s refined zinc production in January increased by just 1% month-on-month but declined nearly 8% year-on-year, with February’s production forecasted to drop further due to holiday shutdowns and maintenance. Technically, the zinc market is under short covering, with open interest falling by 19.63% to 1,372. Immediate support is at 269.9, with further downside potential to 268, while resistance is seen at 273.2, and a breakout above could push prices toward 274.6.
Trading Ideas:
* Zinc trading range for the day is 268-274.6.
* Zinc rises as PBOC signals timely policy adjustments to boost economy
* PBoC plans to utilize a comprehensive set of monetary policy tools, including interest rates and the bank reserve requirement ratio.
* Zinc inventories in warehouses monitored by the Shanghai Futures Exchange rose 26.3 % from last Friday.
Aluminium
Aluminium prices edged slightly lower by 0.06% to settle at 264.35, pressured by a 17.5% rise in Shanghai Futures Exchange-monitored inventories. However, the downside was limited as the European Union agreed to ban Russian primary aluminium imports in a fresh sanctions package, while the U.S. threatened to impose a 25% tariff on the metal. China’s aluminium production hit a record 44 million metric tons in 2024 but is expected to slow this year due to Beijing’s cap on production aimed at controlling excess supply and reducing carbon emissions. Despite fiscal stimulus measures and improving credit growth, rising domestic production in February and a post-holiday inventory buildup have weighed on prices. Meanwhile, Japan’s bargaining power in quarterly aluminium premium negotiations has weakened due to reduced primary ingot imports and the divestment of overseas smelter holdings. Global aluminium supply trends remain mixed. LME aluminium stocks fell to 547,950 tons, their lowest since May, while on-warrant stocks dropped to 227,775 tons following 28,850 tons in fresh cancellations. In contrast, global primary aluminium output increased by 2.7% year-on-year to 6.252 million tonnes in January, according to the International Aluminium Institute. China’s aluminium exports surged 17% year-on-year in the first ten months of 2024, reflecting strong international demand. Technically, the market is under long liquidation, with open interest falling 16.72% to 1,390. Support is seen at 263.4, with further downside potential to 262.5. Resistance is at 265.6, and a move above this level could push prices toward 266.9.
Trading Ideas:
* Aluminium trading range for the day is 262.5-266.9.
* Aluminium dropped as inventories in warehouses monitored by the Shanghai Futures Exchange rose 17.5%.
* However downside seen limited as EU envoys' agreement to ban Russian primary aluminium imports in a fresh sanctions package.
* Global primary aluminium output in January rose 2.7% year on year to 6.252 million tonnes - IAI
CottonCandy
CottonCandy prices edged up by 0.09% to settle at 54,420 amid concerns over lower cotton output in the 2024-25 season. The Cotton Association of India (CAI) estimated a decline in production to 301.75 lakh bales from 327.45 lakh bales in the previous season due to lower yields in Gujarat and northern regions. Despite the dip in yield, the quality of cotton remains high. By the end of January 2025, total cotton supply is projected at 234.26 lakh bales, comprising 188.07 lakh bales of fresh pressings, 16 lakh bales of imports, and an opening stock of 30.19 lakh bales. Consumption until January is estimated at 114 lakh bales, while exports stand at 8 lakh bales. End-of-January stocks are expected to be around 112.26 lakh bales, with 27 lakh bales held by textile mills and 85.26 lakh bales by CCI, Maharashtra Federation, and other market participants. The CAI has maintained its domestic consumption projection at 315 lakh bales, while export estimates for 2024-25 stand at 17 lakh bales, significantly lower than the 28.36 lakh bales exported in 2023-24. Globally, Brazil's cotton production for 2024-25 is expected to rise by 1.6% to 3.76 million tons, with a 4.8% expansion in planting areas. Meanwhile, China's cotton output is set to increase, impacting world production. The U.S. cotton balance sheet saw minimal changes, with mill use declining slightly and ending stocks rising. Technically, the market is experiencing short covering, with open interest remaining unchanged at 253. Support is at 54,310, with further downside potential to 54,190, while resistance is at 54,540, with a breakout possibly pushing prices to 54,650.
Trading Ideas:
* Cottoncandy trading range for the day is 54190-54650.
* Cotton gains as CAI said the overall cotton output is estimated to dip to 301.75 lakh bales due to lower yield in Gujarat.
* CCI is likely to buy more than 100 lakh bales of cotton at MSP during the current cotton year.
* Brazil’s 2024-25 cotton production is projected to be 1.6 per cent higher.
* In Rajkot, a major spot market, the price ended at 25699.35 Rupees dropped by -0.03 percent.
Turmeric
Turmeric prices declined by 0.67% to settle at 13,120 as new crop arrivals commenced in key markets like Nizamabad and Hingoli. Despite an increase in the turmeric cultivation area by 10% to 3.30 lakh hectares this season, production is not expected to rise proportionally due to untimely rains affecting productivity. The Nanded region, in particular, is facing an estimated 10-15% drop in yields due to small rhizomes and crop rots. Last year, turmeric production stood at 10.75 lakh tonnes, and this year’s output is expected to remain similar, fluctuating by 3-5% based on harvesting outcomes. On the trade front, turmeric exports increased by 9.80% year-on-year to 121,601 tonnes between April and November 2024, compared to 110,745 tonnes in the same period of 2023. However, monthly exports in November 2024 saw a decline of 20.18% from October but remained significantly higher (48.22%) than November 2023 levels. Meanwhile, turmeric imports surged by 101.80% during April-November 2024 to 18,937.95 tonnes from 9,384.42 tonnes in the same period of 2023. Despite this yearly increase, November imports were down by 34.84% from October 2024. In the major Nizamabad spot market, turmeric prices dropped by 0.63% to 13,073.8 per quintal. Technically, the market is under fresh selling pressure, with open interest increasing by 0.21% to 11,975. Turmeric is currently finding support at 13,030, with a potential downside to 12,940, while resistance is seen at 13,244, and a breakout could push prices to 13,368.
Trading Ideas:
* Turmeric trading range for the day is 12940-13368.
* Turmeric dropped as arrival of new turmeric crop has started.
* However downside seen limited as new crop yields are expected to be 10-15% lower this year.
* Turmeric area was recorded as 3.30 lakh hectares, which is 10 percent more than the area of about 3 lakh hectares.
* In Nizamabad, a major spot market, the price ended at 13073.8 Rupees dropped by -0.63 percent.
Jeera
Jeera prices declined by 0.99% to settle at 20,990 due to sluggish demand, with existing stock fulfilling export orders. However, the downside was limited as the new crop arrival in Gujarat has been delayed by a month due to unfavorable weather. Sowing in key producing states like Gujarat and Rajasthan also started late, impacting the supply outlook. Farmers still hold around 20 lakh bags of jeera, but only 3-4 lakh bags are expected to be traded by the end of the season, leaving a significant carry-forward stock of 16 lakh bags. India's jeera production in 2023-24 increased to 8.6 lakh tonnes from an area of 11.87 lakh hectares, compared to 5.77 lakh tonnes from 9.37 lakh hectares in the previous year. The current season's production is expected to be similar to last year due to favorable crop conditions. Meanwhile, India remains the world's cheapest source for jeera, with prices at $3,050 per tonne, making it attractive to buyers, including China, where jeera is priced $200-$250 higher. Tensions in the Middle East have also boosted demand for Indian jeera exports. Exports surged 74.04% year-on-year between April and November 2024, reaching 147,006 tonnes compared to 84,467 tonnes in the same period in 2023. However, monthly exports in November 2024 fell by 28.92% from October. In Unjha, a key spot market, prices dropped by 0.71% to 21,153.9 per quintal. Technically, jeera is under fresh selling pressure, with open interest rising by 1.76% to 2,775. Jeera finds support at 20,740, with further downside to 20,490, while resistance is at 21,360, with a potential rise to 21,730.
Trading Ideas:
* Jeera trading range for the day is 20490-21730.
* Jeera dropped as demand is low and the current export business is being met from the available stock.
* However downside seen limited as the start of the new crop of cumin in Gujarat has been delayed by about a month.
* Jeera exports during Apr-Nov 2024, rose by 74.04 percent to 147,006.20 tonnes compared to 84,467.16 tonnes during Apr-Nov 2023.
* In Unjha, a major spot market, the price ended at 21153.9 Rupees dropped by -0.71 percent.
Views express by all participants are for information & academic purpose only. Kindly read disclaimer before referring below views