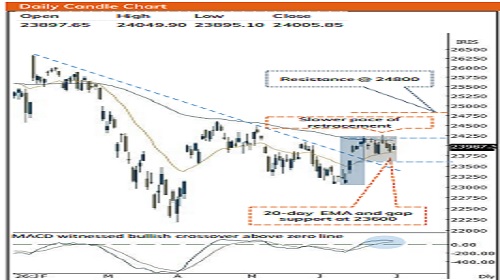
The index started the day on a positive note and witnessed supportive efforts emerging around its 50-day EMA - ICICI Direct

Nifty : 24005
Technical Outlook
Day that was ..
• The equity benchmark snapped its two-days losing streak, with the Nifty closing at 24005, up 140 points. Market breadth remained positive with an A/D ratio of 1.2:1. Broader markets mirrored the benchmark with both Nifty Midcap and Smallcap gained 0.30% each. Sectorally, Realty, FMCG and Auto were the top gainers while IT, Metals and Pharma were the top laggards
Technical Outlook :
• The index started the day on a positive note and witnessed supportive efforts emerging around its 50-day EMA. The daily price action resulted into bullish candle, indicating buying demand from elevated levels.
• Structurally, over past 8 session index has seen consolidating near 38.2% retracement of its previous 6-days ~1100 points upmove, indicating slower pace of retracement. Going ahead, the Nifty requires a decisive close and sustenance above the 100-day EMA and the 24,200 mark (the high of the recent two-week doji-like candles) to resume its upward trajectory toward 24,800 in the month of July. Failing this, the index is likely to prolong its consolidation within the 23,600-24,200 range.
• The elongation of rallies followed by shallow retracement underscores underlying strength that makes us revise support base at 23600. Hence, any decline should be used to accumulate quality stocks, as strong support holds at 23600 being gap support dated 12th June 2026 coincided with 50% retracement of June rally (23072- 24189). Our Constructive bias is based on following observation :
a) Bank Nifty: After 3 months corrective phase, index closed above previous month’s high, confirming bullish reversal. Further, five years consolidation breakout on ratio chart of Bank Nifty vs Nifty signifies outperformance going ahead. Expect Bank Nifty to head towards 60000 in the near term
b) Mid/Small-Caps: Cup & Handle breakout on monthly chart of Midcap index augurs well for acceleration of upward momentum towards 70,000 (14% upside). While, 18 months falling trend line breakout in small cap index bodes well for catch up activity towards 22600 (20% upside)
c) Easing of geopolitical tension: Re-opening of Strait of Hormuz has triggered a sharp correction in Brent Crude Oil prices which is trading at three months low ($71). The softening of base metal prices along with falling crude oil is expected to moderate inflation pressure
Key Monitorable :
US 10 Year Bond Yield: Retreated precisely from upper band of 3 years falling channel. Sustenance below 4.3% would provide highly supportive macro backdrop for emerging markets
Intraday Rational :
• Trend – supportive efforts emerging around its 50-day EMA, indicating strong demand from key moving average
• Levels – Buy around 61.8% of last 2 days range
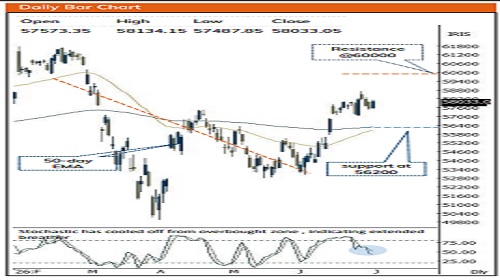
Nifty Bank : 58033
Technical Outlook
Day that was :
Bank Nifty Index regained momentum after two days breather and closed the day on positive note up 0.85% at 58033.
Te chnical Outlook :
• Index opened on a positive note and witnessed supportive efforts emerging from previous session low that coincided with 10 days EMA. The daily price action resulted into bullish candle wherein intraday dips were bought into indicating positive bias.
• Key highlight is that post three consecutive session of corrective phase, index decisively closed above its previous session high, indicating end of corrective bias. Going ahead we expect index to resume its upward momentum and challenge the recent swing high of 58700 and pave the way towards 60000 in coming weeks
• The ratio chart of Bank Nifty vs Nifty has witnessed breakout from a 5-years consolidation. This technical setup signals that the banking index is poised to accelerate its relatively outperformance and head towards 60000 in the coming month as it is gap-area formed on 2nd March 2026
• The elevated buying demand highlights strength, thereby any decline should be capitalized as incremental buying opportunity as strong support is placed at 56200 being 200-day EMA coinciding with 61.8% retracement of current up move(55726- 58021)
• PSU Bank Index seen buying demand emerging from 50 days EMA. Over past seven sessions index has seen healthy consolidation after 11% rally seen during June. Going forward we expect Index to consolidate in range 8450-8800 in coming sessions and set the stage for next leg of up move
Intraday Rational :
• Trend - post three consecutive session of corrective phase, index decisively closed above its previous session high, indicating end of corrective bias.
• Levels Buy around 61.8% of last 2 days range
Please refer disclaimer at https://secure.icicidirect.com/Content/StaticData/Disclaimer.html
SEBI Registration number INZ000183631