The index opened with a significant gap down and witnessed sustained selling pressure throughout the session - ICICI Direct

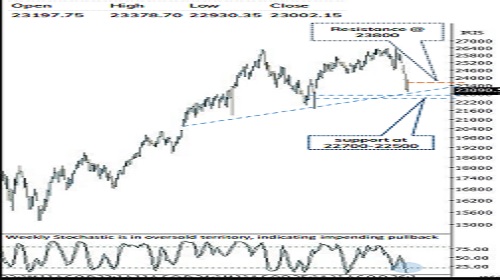
Nifty :23002
The Indian equity benchmark snapped a three-day winning streak, declining ~770 points to settle at 23,002. Market breadth weakened sharply, with the A/D ratio at 1:5. The broader markets mirrored the benchmark’s weakness, with both mid and smallcap indices declining ~3% each. Sectorally, all indices closed in the red, with Auto, BFSI and Realty emerging as the top laggards..
Technical Outlook:
* The index opened with a significant gap down and witnessed sustained selling pressure throughout the session. Consequently, the daily price action formed a bearish candle, erasing the gains of the previous three trading sessions, signaling selling pressure at higher levels.
* Index is set to open on positive note ahead of cool-off in crude oil prices from elevated level. A key point to highlight is that after three sessions of recovery, index came under pressure amid escalating geopolitical tensions in the Gulf, a sharp surge in crude oil prices, and a relatively hawkish outcome from the US Fed. The index breached its recent swing low of 22,955 intraday; however, it managed to close above the same, indicating key near-term support.
* Going ahead we expect the bouts of volatility would remain elevated amid geopolitical tensions. In the process, Nifty holding 22955 (on a closing basis) would be a key level to watch out and sustaining above 22955 would keep pullback options open. Failing which, would result into extension of correction towards key support of 22700-22500, being 80% retracement of preceding upmove (21743-26373), signifies strong structural support.
Sentiment & Momentum indicator at bearish extremes, indicating impending pullback:
a) Past four decades data suggest, amid geopolitical tension price-wise median correction has been around 11% while time wise index has spent median 4 weeks. Buying during such a panic scenario has garnered >25% returns in next 3-6 months. In current scenario, with past two weeks correction, Nifty has already corrected 11%. Hence, to maintain the same rhythm, Nifty need to stabilize around key support of 22700- 22500 in the coming weeks.
b) Historically, there have been six instances when the % of Nifty 500 stocks above the 50 & 200-day SMA slipped toward the ~15 alongside net of A/D value near ~440 mark, signaled capitulated extremes. Historically, such contractions in breadth have preceded durable market bottoms. With current decline, the % of stocks above 50- and 200-days SMA have once again pulled down to 18% and 21% levels. And Net A-D stands at 445, reflecting similar past structure of correction and bottom formation.
c) Stochastic oscillator in daily weekly and monthly time frame has entered into oversold territory, indicating limited downside.
d) Positive RSI divergence in daily time-frame, indicating a pullback from oversold zone cannot be ruled out.
Key Monitorable:
* De-escalation of geopolitical tension
* Cool off in Crude oil prices
Intraday Rational:
* Trend- Positive RSI divergence in daily time-frame, indicating impending pullback
* Levels- Buy around yesterday’s low (22940)
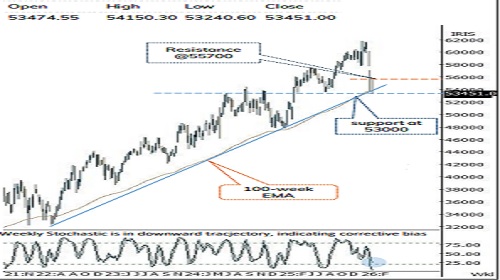
Nifty Bank :53451
Bank Nifty snapped its three-day winning streak, declining 2.9% to close at 53,451, while the Nifty PSU Bank Index mirrored the benchmark performance and declined 2.4%.
Technical Outlook:
* The index opened the session with a gap-down and remained rangebound during first half of the session. However, selling pressure emerged in the latter half, dragging prices lower towards the close. The daily price action resulted in a doji-like candle, indicating indecisiveness with a negative undertone.
* Index is set to open on positive note tracking ease in crude oil price. Notably, the index has erased its entire three-day recovery and breached its recent swing low of 53,250, though it managed to close above this level making it a key support to monitor on a closing basis.
* From a structural perspective, immediate support is placed around the 53,000 mark, which coincides with the lower band of the long-term rising channel in place since June 2022, as well as the 61.8% retracement of the March 2025-February 2026 up move (47702- 61764). Sustenance above the 53,250-53,000 zone post the recent gap-down will be important to keep the possibility of a pullback option open.
* Momentum indicators, however, are deeply stretched, with the weekly stochastic hovering near ~3, indicating extreme oversold conditions. This suggests that a relief rally cannot be ruled out, and hence aggressive short positioning at current levels may not be prudent.
* On the broader space, the Nifty PSU Bank Index continues to exhibit relative resilience despite forming a bearish candle. The index is approaching a key support zone near 8,100, which marks its prior breakout level and aligns with the 61.8% retracement of the September 2025-January 2026 rally, reinforcing it as a strong demand zone.
Intraday Rational:
* Trend- Previous three-day gain erased in single session indicating profit booking at higher levels
* Levels- Sell around 80% of previous session range (54298-53290)
Please refer disclaimer at https://secure.icicidirect.com/Content/StaticData/Disclaimer.html
SEBI Registration number INZ000183631


Tag News
Market Round-up - 14th July 2026 by Motilal Oswal Wealth Mangement