The index broadly oscillated in 100 points range and settled the weekly expiry session on a flat note - ICICI Direct

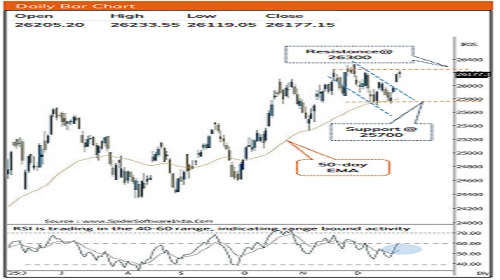
Nifty :26177
Technical Outlook
Day that was…
Equity benchmark concluded weekly expiry session on a flat note as Nifty settled at 26177. Market breadth remained in favour of advances with A/D ratio of 1.4:1 as Smallcap gained 0.4%. Sectorally, Financials, Metal remained in focus while IT took a breather.
Technical Outlook:.
* The index broadly oscillated in 100 points range and settled the weekly expiry session on a flat note. The daily price action resulted into high wave candle carrying higher high-low pattern, indicating continuation of positive bias amid elevated volatility.
* The formation of higher high-low after witnessing breakaway gap in last session, highlights continuation of uptrend. We expect across sector participation would result into broadening of ongoing up move that would drive Nifty towards 26300 and eventually pave the way to head towards 26700 in the coming month.
* Over past two months, Nifty has been defending short-term moving average of 50 days EMA that coincided with last week’s low of 25700, highlighting key support threshold
Our constructive bias is outlined on the basis of following observations:
a) Structurally, the index has resumed uptrend after undergoing a slower pace of retracement. With past three weeks correction it has retraced merely 61.8% of preceding three week’s rally.
b) The Bank Nifty has been trading around its 20 days EMA despite ongoing global volatility. Meanwhile, pullback in IT and Oil & Gas signifies revival in upward momentum. Together these three sectors account for >55% of Nifty’s weightage
c) Santa rally on cards: Historical data since 1995 suggest that, on 77% of the occasions Nifty has delivered positive returns in last 10 days of the year with the average gain of 3%
d) USD/INR: Price action since February 2016, has been confined in a rising wedge and has historically exhibited a strong inverse correlation with the Nifty. Historically, there have been five instances where a retreat in USD/INR from the upper band of this wedge averaging a ~4% decline (with a maximum drawdown of ~7%) over a two-month period was followed by the Nifty delivering average gains of >10% over the subsequent two months. Last week, USD/INR once again retreated from the upper end of its long-term rising wedge. The setup closely mirrors these past inflection points, suggesting the potential for a similar cyclical rhythm to unfold in coming weeks
Key Monitorable for the next week:
* US and India Tarde Deal: The favourable outcome of US and India trade deal could accelerate the positive momentum in the market and pave the way for return of FII’s in the Indian markets.
Intraday Rational:
* Trend- Follow-through to falling channel breakout, signifies continuation of uptrend
* Levels: After a positive opening, dip towards 80% of previous 2day up move (26131-26259)should be used as buying opportunity
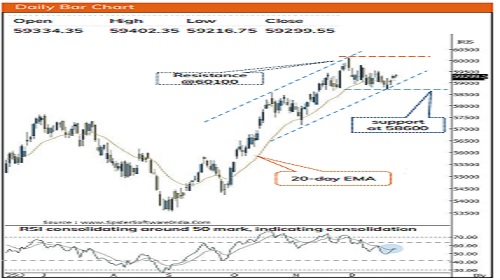
Nifty Bank : 59299
Technical Outlook
Day that was:
Bank Nifty ended on flat note at 59300, on back of mixed global cues. The Nifty Private Bank Index was also inline with benchmark closing -0.1% closing at 28486 levels.
Technical Outlook:
* Bank Nifty after opening on a flat note consolidated within previous session high-low range in 216 points range (59155- 59371) and sustained above 20-day EMA. The daily price action formed a small bear candle with shadows on either sides indicating indecisiveness at current levels.
* We believe Index would challenge upper band of consolidation at 60100 in coming weeks and thereafter head towards 60500 levels in coming months
* After lower high lower low Index is now forming higherhigh-low on weekly time frame after witnessing slower pace of retracement as it has taken 3 weeks to retrace 4 weeks of rally(57158-60114) by 50% retracement. It has been sustaining above its 20-day EMA which has been held since October2025
* The Private Bank Index has maintained its higher high higher low formation on daily chart while rebounding from its 50- day EMA. The stochastic indicators has generated bullish crossover from oversold territory suggesting positive momentum. Nevertheless, pullbacks should be viewed as accumulation opportunities, with strong support around 28,265, aligning with the 50% retracement of the 27613– 28,960 rally and the 50-day EMA
Intraday Rational:
* Trend- falling trendline breakout, signifies resumption of uptrend
* Levels- After a positive opening, dip towards yesterday low (59346-59514)should be used as buying opportunity
Please refer disclaimer at https://secure.icicidirect.com/Content/StaticData/Disclaimer.html
SEBI Registration number INZ000183631