The index formed a Doji candle on the weekly chart, signaling a pause in momentum - Tradebulls Securities Pvt Ltd

Nifty
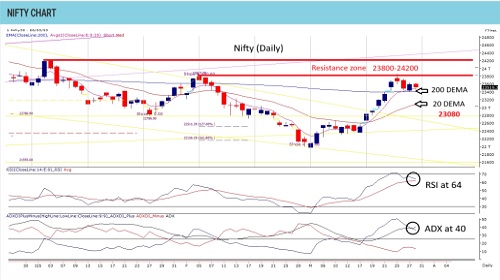
The index formed a Doji candle on the weekly chart, signaling a pause in momentum. It faced profit booking near 23,800 but managed to hold above the 200 DEMA support at 23,400. A breakdown below this level could lead to a dip toward 23,070 (20 WEMA support), which looks likely this week. On the other hand, the weekly RSI remains well-positioned for a breakout, and the ADX turning towards 25 indicates that the broader bullish trend is intact. Options data highlights firm resistance at 24,000, while the highest put OI concentration is placed at 22,000, especially if the index slips below 23,500. A decisive move above 23,800 could reignite the uptrend, but traders should remain cautious when deploying long positions within the 23,800–24,200 zone. Since there is no major reversal signal, dips toward 23,070 would be an opportunity to add fresh longs. For now, the 23,800–24,200 zone remains critical, while a move below 23,000 would create a strong demand zone for fresh long positions. Until the index breaks out of the 24,200–23,000 range, a long-short strategy remains ideal.

Please refer disclaimer at https://www.tradebulls.in/disclaimer
SEBI Registration number is INZ000171838


More News

Pre-Market Comment by Hardik Matalia, Derivative Analyst, Choice Broking


