The Economy Observer : Short-term impact of General Elections on the markets and economic indicators By Motilal Oswal Financial Services Ltd
Short-term impact of General Elections on the markets and economic indicators
It is difficult to find a strong connection between them
The countdown begins in earnest: India prepares to hold its 18th Lok Sabha elections in Apr-May’24. General elections are assumed to have wide-ranging consequences, affecting not only the political and economic landscape but also the financial markets. In this note, we focus on the short-term impact of general elections on four broad parameters: 1) financial markets, 2) monetary variables, 3) fiscal parameters, and 4) indicators related to the rural economy. For most of our analysis, we consider data from the past five elections (i.e., 1999, 2004, 2009, 2014 and 2019) and analyze the changes in these indicators pre- and post-elections, i.e., six months before and after the election results. Overall, the benchmark large-cap equity market index (Nifty50) has increased both before and after the elections, with lower 10-year bond yield during most election periods and no uniform trends in the currency. Further, we find it difficult to establish any uniform patterns in monetary or fiscal variables visà-vis election years. Within the rural sector indicators, MSP hikes tend to be higher in the year before elections, but other indicators do not show any connection.
Impact on financial markets before and after elections:
* What are the typical behaviors of different financial markets before and after election results are announced? In this section, we provide answers using data on the equity market (Nifty-50 index), 10-yr bond yield, Indian Rupee vs. US Dollar (INR/USD), and foreign portfolio investment (FPI) flows. Broadly speaking, equity markets (and FPI equity flows) appear to grow in the six-month period before and after results, with lower yields in the majority of election periods and stronger/weaker INR/USD in the pre-/post-result periods during the last two elections.
* An analysis of the past five general elections suggests that the stock market (using point-to-point data) has exhibited higher returns in the run-up to elections, and while there are immediate fluctuations post-election results, the equity market totally absorbs them over time (Exhibit 1). Nifty-50, a benchmark index of India’s large-cap listed companies, has grown between 7% and 36% in the run-up (i.e., six months prior) to general elections since 1999, with an average growth of 21% during the last five elections. In the quarter following the election results, markets fell twice (in 2004 and 2019); however, they moved into the growth territory within the subsequent quarter (i.e., six months after the election results), with an average growth of 14% during the past five elections. The trends are broadly similar for the mid-cap and smallcap indices as well.
* A similar analysis for the benchmark 10-year government bond yield reveals that the yield fell four times in the last five pre-election periods (except in 2004), with an average decline of 40bp (one bp is one-hundredth of a percentage point – pp). Unlike the Nifty-50, the movements in the post-result period gain strength over time but do not change direction. For instance, the bond yield fell in three of the past five post-result periods (except in 2004 and 2009). The fall in yields in 1999, 2014 and 2019 in the month following the results exacerbated in three and six months after the results. Similarly, the 10-year yield rose in the month immediately post-results in 2004 and 2009, which increased further in the following three-month and six-month periods (Exhibit 2).
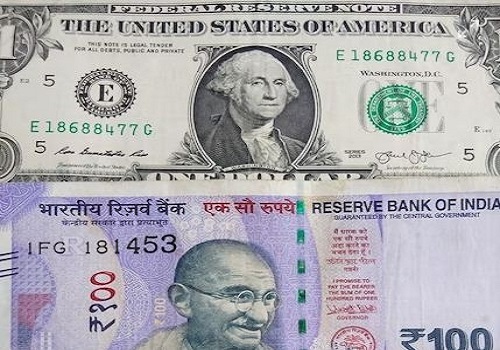
* An analysis of the movements in INR/USD reveals that INR weakened in the pre-election period in 1999; it was broadly stable in 2004 and 2009; while it strengthened in 2014 and 2019 (Exhibit 3). Interestingly though, the INR appeared to strengthen against the USD in the month post-elections every time, except in 2014. Over the next few months (i.e., six months post-results), however, INR strengthened against the USD in 2004 and 2009, while it weakened in 2014 and 2019 (when it had strengthened in the pre-election period). The only uniformity, thus, happens to be that the pre- and postresult movements in the INR/USD are opposite to each other, as confirmed by the past four general elections.
* In line with the trends seen in equity markets, the FPI equity inflows have also been positive during the past five pre- and post-election periods (Exhibit 4). Notably, FPI equity inflows in the post-result six-month period were only 0.2x of the pre-results six-month period in 2019, while they were as much as 8.4x in 2009 (which suffered due to 2008 great financial crisis). Interestingly, the pre-election FPI equity inflows were ~USD10b each in 2014 and 2019, albeit they were notably lower in the post-result period in 2019 (only USD2.4b), compared to 2014 (only USD8.9b). The conclusions are not very different for total (equity + debt) FPI flows (Exhibit 5).
For More Motilal Oswal Securities Ltd Disclaimer http://www.motilaloswal.com/MOSLdisclaimer/disclaimer.html
SEBI Registration number is INH000000412