The Bank Nifty settled the week on a subdued note amid rise in volatility, where it closed at 48 ,497 , up by 153 points - ICICI Direct

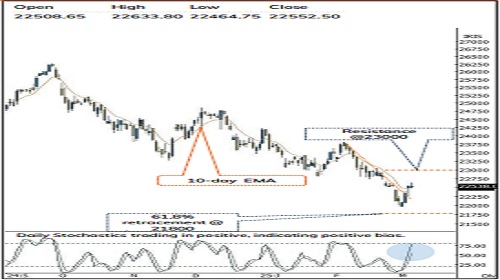
Nifty :22552
Technical Outlook
Week that was
Indian equity benchmarks snapped a three-weeks decline and closed positive. The Nifty settled at 22,552, up by ~2%. The market breadth was positive in favor of advances, with an A/D ratio of 2:1, as the broader market outperformed on weekly basis where both the Nifty midcap index and the Nifty small cap index closed on a strong positive note, up by 2.66% and 5.47% respectively. Sector-wise, all sectors closed in the green, with Metals leading the rally, tracking the falling US Dollar Index, while PSU Banks and Power witnessed a sharp pullback.
Technical Outlook:
* The Nifty opened the week with a gap-up (22124-22194) and, after two days of decline, supportive effort at the long-term rising trendline helped the index to recover most of the week declines. As a result, the weekly price action formed a Bullish piercing candle, indicating buying interest at lower levels.
* A key point to highlight is that, the Index broke out from a falling trendline on daily timeframe and closed the week with its highest gain in 2025, indicating renewed momentum. This improvement makes us believe that the index is poised for an upward move towards the 23000 level. Meanwhile, 21800 would continue to act as key support. Our view of a technical pullback is backed by the following observations:
* a. Over the past three decades, the average drawdown below the 52-week EMA as been 6-7%, followed by >20% returns over the next 12 months. The Nifty is currently ~6% below its 52-week EMA, supporting a potential recovery.
* b. Market breadth recently hit a bearish extreme, as the % of stocks (within Nifty 500 universe) above their 50 and 200 days SMA dropping to 8 and 10 , respectively, during the corrective phase. However, it has now rebounded to 18 and 13, indicating early signs of recovery. Historically, such bearish readings have paved the way for a durable bottom in the subsequent weeks.
* c. Mirroring the Trump phase (2017), the Dollar Index topped out in January and now breached its December 2024 low of 105, which is favorable for emerging markets like India.
* d. The US 10-year bond yields has corrected ~70 bps from its January highs and has formed a bearish evening star candlestick pattern on the monthly chart, reinforcing the corrective bias.
* e. Brent crude hovering Near 2-Year Lows and is now sustaining around the $70 mark, which augurs well for inflation control and market sentiment.
* f. The monthly stochastic oscillator is in the extreme oversold territory at 13 (lowest since 2002), indicating an impending pullback.
* g. Global Market like DAX (Germany) clocked a fresh all-time high, and the Hang Seng Index surpassed its two-year high, signaling improving risk appetite in Asian markets.
* e. The India VIX is at 13.5, indicating low risk perception from market participants.
* On the broader market front, the Midcap and Small cap indices, witnessed supportive efforts from the decade-long trendline (Adj Jan 08 high and Oct 21 high) coupled with a positive divergence of the RSI, suggesting that the midcap index could witness extended pullback toward 51500, while the small-cap index may reach 16000 levels. Hence, the focus should be on accumulating quality stocks (backed by strong earnings) in a staggered manner.
* Structurally, after a five-months, 16% decline, the index has now approached the longterm rising trendline (Adj Jun22 low and Mar23 low) amid oversold conditions. The formation of a lower high-low signifies corrective bias, wherein strong support is placed around the 21800-22000 zone due to the confluence of:
* a) 61.80% retracement in the vicinity of 21800 from the rally (18837-26227)
* b) A rising trendline drawn adjoining subsequent major lows off Jun-22 (15183) is placed at 22000.
* c) The 24-month EMA support is placed in the vicinity of 22000.
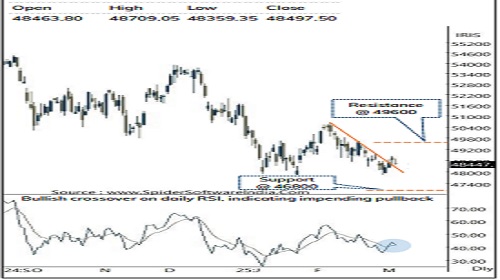
Nifty Bank : 48497
Technical Outlook
Day that was
The Bank Nifty settled the week on a subdued note amid rise in volatility, where it closed at 48 ,497 , up by 153 points . However, the PSU Banking index witnessed a stupendous rally and outperformed the benchmark move where it settled at 5931 , up by 4 .94 % for the week .
Technical Outlook:
* The Bank Nifty witnessed recovery from the lower end of the broader consolidating range of 49600 -48700 amid volatile week due to the US tariff related development . The price action resulted in a doji like candle, indicating supportive efforts at lower level .
* Key point to highlight is that, the Bank Nifty is trading in a higher high low pattern after defending the lower end of the broader consolidation range for the third time this week in past two months . Moreover, it witnessed a falling trendline breakout (drawn adjoining the highs of 17th Feb & 19th Feb), indicating structural improvement . Hence, we expect continuation of the technical pullback towards the upper end of the broader consolidation range (49600), coinciding with 52 -week EMA . On the downside, near -term support is placed at 46800 which is 61 . 8 % retracement of Oct -23 to Sept -24 rally (42105 -54467 ) .
* Structurally, with 12 % correction already in place the index is witnessing a base formation near the lower band of 2 years rising channel, which is also in the vicinity of 100 -week EMA . The change in market breadth observed in the current week augurs well for the durability of the ongoing pullback and continue the upward momentum in coming weeks .
* In tandem with the benchmark index, the Nifty PSU Bank index witnessed buying demand from the vicinity of 50 % retracement mark of the previous up -move (3528 -8053 ) . The price action resulted in a big bullish candle which recovered the entire decline of the previous week . The daily RSI witnessed a falling trendline breakout, indicating acceleration in the up -move . Going ahead, a close above the previous week high will fuel the upwards momentum in coming weeks and take index towards the mark of 6200 being 38 . 2 % retracement of the previous decline (7248 -5697 ) .
Please refer disclaimer at https://secure.icicidirect.com/Content/StaticData/Disclaimer.html
SEBI Registration number INZ000183631