The Bank Nifty continued the selling pressure for third consecutive week, where it traded within a tight range of 900 points throughout the week - ICICI Direct

Nifty :22125
Technical Outlook
Day that was
Indian equity benchmarks extended their losing streak for a third consecutive week, weighed down by global volatility and tariff related uncertainty. The Nifty declined 3% to close at 22,125. The market breadth remained in favor of declines with the A/D ratio of 1:5 as both the midcap and small cap segments retreated by over 5% each. Sector-wise, all sectors ended the week in the red, with IT, Realty and PSU Bank emerging as the weakest performers
Technical Outlook
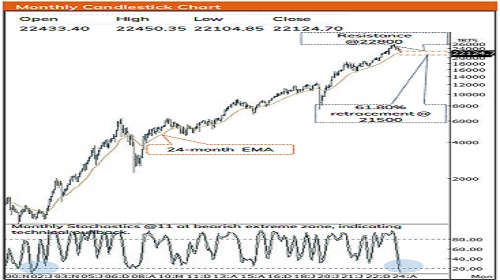
* Nifty opened the week with a gap down (22796-22609) and soon witnessed a sell off making lower low-high, Consequently, weekly price action resulted into bear candle, indicating continuation of corrective bias
* The index accelerated its downward momentum upon breaching the immediate support level of 22800. The lack of follow through strength above previous week’s high signifies continuation of corrective bias. However, we believe that investors should refrain from panicking at current juncture as index corrected 16% in last 5 months approaching oversold condition. Hence, we anticipate that the ongoing corrective move would find its feet in the vicinity of key support threshold of 21800- 21500 zone wherein earlier support of 22800 would now act as key resistance. Eventually, we expect the index to undergo base formation over next couple of weeks based on following observations:
* A) The monthly stochastic oscillator is trading in the extreme oversold territory of 11 (lowest since 2002), indicating impending pullback.
* B) The market breadth has approached the bearish extreme as % of stocks (within Nifty 500 universe) above 50 and 200 days SMA has approached their bearish extreme of 8 and 10 respectively in current corrective phase. Historically, such bearish readings have paved the way for durable bottom in subsequent weeks.
* C) The US 10-year bond yields has corrected 7% for the month and now appears to be forming bearish evening star candlestick pattern on the monthly chart, reinforcing the corrective bias.
* D) The US Dollar index has remained in the vicinity of 107 for the second consecutive month; any further weakness in the dollar would be supportive for emerging markets.
* E) Brent crude has snapped two months up move and sustaining well below $73 mark, which augurs well for the Indian economy and equity markets.
* F) Continued de-escalation of geopolitical tensions is expected to bring additional stability to the equity markets.
* On the broader market front, historical data from the past two decades suggest that in bull market phases, the Nifty midcap and small cap indices typically correct by 27% and 29%, respectively. In the current scenario, we believe both indices are approaching extremes of their bull market correction as Nifty midcap and small cap have already corrected 22% and 26%, respectively, indicating limited downside going ahead. Hence, focus should be on accumulating quality stocks (backed by strong earnings) in a staggered manner.
* The formation of lower high-low signifies corrective bias wherein strong support is placed around 21500-22000 zone as it is confluence of:
* a) 61.80% retracement in the vicinity of 21500 of rally from (16828-26227)
* b) Rising trend line drawn adjoining subsequent major lows off Jun-22 of 15183 is placed at 22000.
* C) The 100-week and 24-month EMA support clustering in the vicinity of 22000.
Nifty Bank : 48345
Technical Outlook
Day that was:
The Bank Nifty concluded the last week of the month on a negative note, amid volatility, down by 1 .30 % . Meanwhile, the Nifty PSU Bank index bore the blunt of selloff resulting in underperformance and concluding the week on a negative note at 5652 , down by 5 .33 %
Technical Outlook:
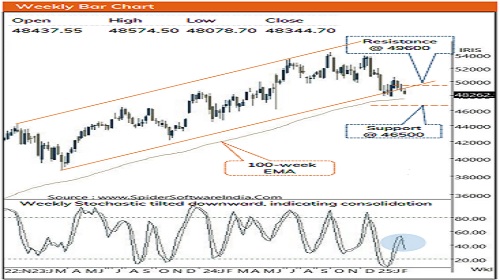
* The Bank Nifty continued the selling pressure for third consecutive week, where it traded within a tight range of 900 points throughout the week . The price action resulted in a small bear candle, which signals continuation of corrective bias .
* Key point to highlight is that, the index is consolidating in a broader range 49600 -48700 and with no significant follow through movement on either side, indicating that the consolidation is likely to continue, amid volatility . A breakout on either side of the range would dictate the further course of action .
* Structurally, the Bank Nifty has shown resilience by holding above the previous swing low contrary to the Nifty index and witnessed a higher low pattern formation in the vicinity of the lower band of 2 years rising channel, indicating relative strength . However, the lack of follow through buying above previous weeks high is required to move towards the mark of 49600 , being previous swing high, coinciding with 52 -week EMA . On the other side, the near -term support is placed at 46500 mark which is in the vicinity of election days low .
* In tandem with the benchmark index, the Nifty PVT Bank index witnessed a rangebound action where it traded within a tight range of 450 points throughout the week . Structurally, the index is witnessing slower pace of retracement as over past three weeks it has retraced only 50 % of preceding 2 weeks up move (23508 -25025), indicating relative outperformance . Going ahead, we believe that the index will continue to resolve higher towards 25000 mark, being previous swing high . Meanwhile, immediate support is placed at 23500 , being the recent swing low .
Please refer disclaimer at https://secure.icicidirect.com/Content/StaticData/Disclaimer.html
SEBI Registration number INZ000183631