

Technical Thematic Report 2025 by Nirmal Bang Ltd
Nifty’s Next Leap….Insights for 2025

The Nifty index is indeed showing a classic uptrend pattern with higher highs and higher lows, confirming the strength of the trend based on Dow Theory. Currently, it’s trading near the midpoint of the rising channel, around 25,240. A close above this level could signal a move toward the top of the channel. Looking towards the technical setup we believe the trend is positive but in any circumstance if we face any small retracements that can be used as an opportunity to build-up the Long position
Key Levels to Watch:
Support Levels:
* 24,700 (S1- Buy Opportunity)
* 24240-23670 (S2 Zone)
* Structural Support: 23,670 (must hold to maintain Bullish bias)
Resistance Levels:
* 26300 (R1) (upside potential)
* 27400-28600 (R2 Zone) (Major resistance)
Historical Context
* Breaking All-Time Highs: Historically, when Nifty breaks its all-time high (26,277), it tends to consolidate or extend its upward move in the next 1-2 quarters.
* Potential Upside: A sustained close above 26,277 could lead to further upside potential towards 5-8% approx. (27,400-28,600) in the quarter. (*LAST LEG OF BULL MARKET)
Market Outlook:
The Nifty index is trading within an ascending channel, indicating a bullish structure. If Nifty sustained move above 25,240 could confirm bullish continuation.
Trading Strategies:
* Momentum Trades: Breakout above 25,240 for upside of 26,300-27,400+.
* Traders: Current long position may keep on hold and even if its correct buy-on-dips near 24,700-24,400 with upside of 26,300+.
* Investors: Stay long; maintain positions while trailing stop-loss levels upward.
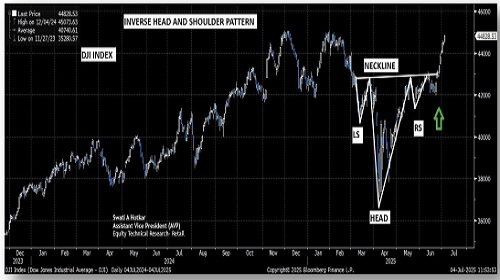
DOW JONES INDUSTRAIL AVERAGE INDEX: INVERSE HEAD AND SHOULDER
Here's a breakdown of the pattern and its implications:
Pattern Details:
The Dow Jones Industrial Average has formed an Inverse Head and Shoulders pattern, a classic Bullish signal.
* Left Shoulder: Formed around 40,300
* Head: Formed around 36,600
* Right Shoulder: Formed around 41,800
* Neckline Resistance: 43,000
Breakout and Upside:
* A breakout of 43,000 could trigger a 5,500-6000 point rally.
* Potential upside: 48,500/49,000
* Support range: 42,700-42,000
Current Outlook:
* The index has already rallied 2,000 points after the breakout
* Further 3,500-4000-point movement (7-8% approx.) rally may be expected from current levels.
NIFTY -BSE SENSEX CHART- ROUNDING BOTTOM FORMATION
NIFTY CHART- ROUNDING BOTTOM FORMATION
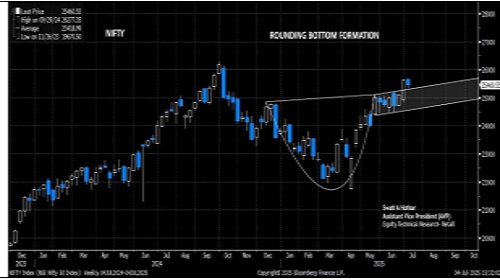
The Nifty index has formed a Rounding Bottom pattern and recently broke out after a five-week consolidation period, indicating a strong bullish trend in the near term. Here are the key points to consider:
Breakout Confirmation:
* The Nifty index is on the verge of giving a Resistance zone breakout at 25,000-25,240, signalling renewed strength in the broader market.
Potential Upside
* Short-term Upside: 26,300
* Long-term Upside: 27,400-28,600 if the breakout sustains
Support Levels
* Key Support Zone: 24,000-23,670
Market Trend:
Positive as long as Nifty maintains support zone, the Bulls are likely to hold their ground.
BSE SENSEX CHART- ROUNDING BOTTOM FORMATION
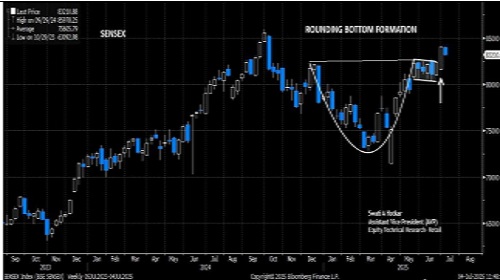
Let's break down the current market scenario:
Current Market Scenario
* Current Level: 82,500
* Support Levels:
Key levels to watch are around 80,000, with potential support at 78,517 and 78,073
Potential Upside
* Short-term Upside: 84,000-85,000
* Long-term Upside: 90,000-92,000, representing potential returns of 8-10% from current levels
Market Trend:
Positive, with predictions continued up-move in 2025.
NIFTY underperforming S&P500 Index……
The below chart indicates the potential of Nifty to catch the rally with S&P500 Index.
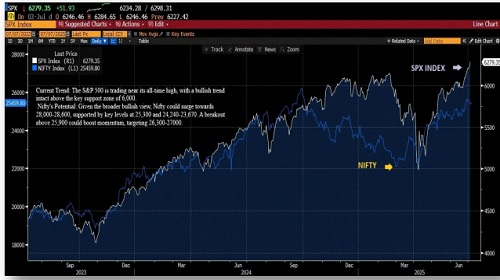
Nifty underperforming the S&P 500 index could indicate potential for catch-up growth.
Current Trend:
The S&P 500 is trading near its all-time high, with a bullish trend intact. Technically, we believe the S&P 500 Index likely to continue its Bull trend towards 6,640-6,800 levels with an immediate support of 6,000 marks on closing basis.
The near-term outlook is slightly mixed, but the broader trend remains constructive. Nifty's underperformance relative to the S&P 500 might be due to various factors, including global cues and sector-specific trends. However, if the S&P 500 continues its rally, Nifty could potentially catch up.
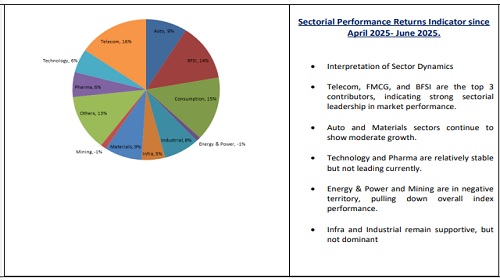
Sectorial Performance Indicator since April 2025- June 2025.
Please refer disclaimer at https://www.nirmalbang.com/disclaimer.aspx
SEBI Registration number is INH00000176


.jpg)
