Technical Picks for New Year 2026 by Nirmal Bang Ltd

SRF Ltd
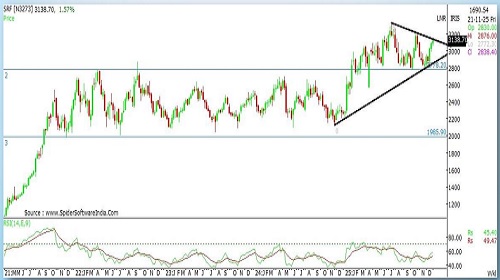
Buy SRF Ltd CMP 3110 ADD ON 2940 SL 2700 TARGET 4180
SRF is seen in a long-term uptrend, weekly chart suggests that the stock is on the verge of giving a breakout from the Symmetrical Triangle pattern. Any breakout from the pattern will lead to a positive upmove in the near term.
Interesting observation is that after the 4-5 years of consolidation phase within the range of 1960-2850 range, this year the stock managed to give a breakout with decent volumes indicating the up move rally.
Monthly chart indicates that the stock is trading in an upward rising channel suggesting strength, Momentum indicator, RSI is trading above the 60 mark suggesting strength in the stock. Stock is well placed above all the important moving averages i.e. 50, 100 and 200 DMA on closing basis.
Therefore, investors can buy the stock at 3110 and add on dips to 2940 for a target of 4180 with a strict stop loss placed below 2700
Bharat Forge Ltd
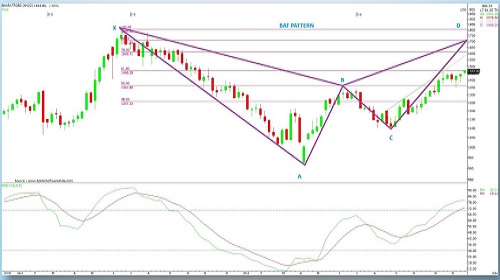
Buy Bharat Forge Ltd CMP 1446 ADD ON 1330 SL 1230 TARGET 1870
Weekly chart has witnessed a sharp correction from its February 2024 peak of Rs.1900, followed by a prolonged decline that eventually found support around the Rs.900 level. Post April 2025 we witness a good reversal from bottom levels with decent volumes.
Interesting fact is that as per the Harmonic Pattern the stock is forming the CD leg of Bearish Bat Pattern suggesting up move in near term towards 1700/1800 levels. Last week stock managed to give the cluster Resistance breakout of 50% mark on closing basis and now its on the verge of giving the breakout of 61.8% Golden Ratio i.e. 1466 indicating potential up move in near term.
After almost one year the stock has managed to cross the 200 DMA and closed above the same indicating strength. In the month of October 2025, it manages to show the Golden Crossover of 50/200 DMA.
Therefore, investors can buy the stock at 1446, add on dips to 1330 for a target of 1870 with a strict stop loss placed below 1230.
R R Kabel Ltd
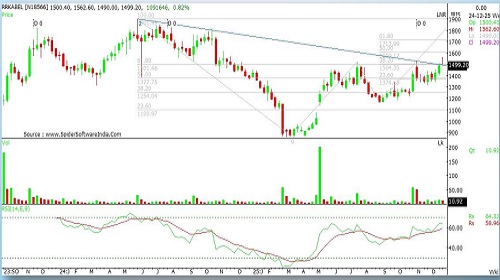
Buy R R Kabel Ltd CMP 1492 ADD ON 1440 SL1820 TARGET 1370
R R Kabel Limited from the capital goods space has witnessed a breakout from the symmetrical triangle pattern with steady volumes, it is currently forming higher tops higher bottom on the weekly chart supporting the upmove.
The stock is well placed above Rs.1500 a support provided by Fibonacci retracement 61.8 % level. The stock now trades in a consolidative rising channel formation with higher lows on Daily chart.
Momentum indicator RSI is well placed above the 60 level on the weekly Chart indicating bullish sentiment in the stock. MACD moves in the positive territory above the zero line with supporting histogram.
Therefore, investors can buy the stock at the level of 1492 and add on dips till 1440 for the target price of 1820 maintaining a strict stop loss around 1370 level.
Container Corporation of India Ltd
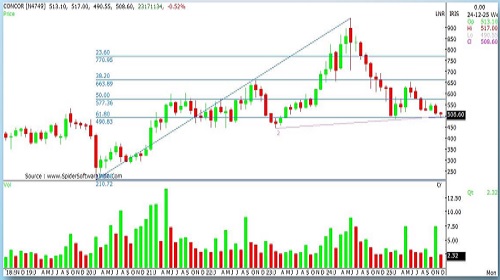
Buy Container Corporation of India Ltd CMP 520 ADD ON 480 SL 440 TARGET 770
Container Corporation of India Limited a large cap player witnessed a long term correction on the weekly charts, forming cluster supports.
The fact that the stock has held above the support levels indicates the strength in price.
The counter witnessed support at 490 i.e. the golden ratio 61.8% of Fibonacci Retracement (low-210 high -944) on Monthly chart, thus creating a good base for the near term positive rally. Momentum Indicators are seen moving sideways with overall setup favoring the buyers, RSI is trading above its mean level of 40 on weekly chart, further supporting a potential up move.
A reversal is expected in the near term wherein the stock can move towards the level of 770 in the short to medium term providing a good opportunity for increased profit.
On the downside support is seen at 440 which acts as a strict stop loss for the counter. Investors can buy the stock at 520 and add on dips till the level of Rs. 480.
Bank of Baroda Ltd
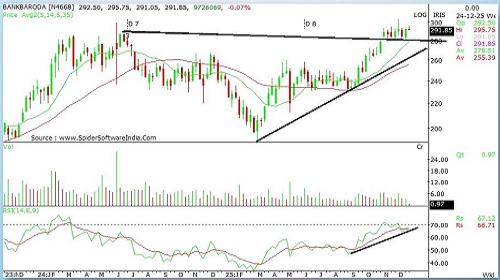
Buy Bank of Baroda Ltd CMP 288 ADD ON 275 SL 260 TARGET 360
Stock has witnessed a 2 yearly resistance breakout after a brief consolidation.
In the last 6 months the stock has seen short covering action with considerable reduction in OI indicating positive bias.
Indicators are suggesting positive bias in the near to mid term.
Stock can move towards 360 levels in the near to mid term. One can add on declines of 275 levels
Stock has good support at 260 levels which should be used as SL.
Please refer disclaimer at https://www.nirmalbang.com/disclaimer.aspx
SEBI Registration number is INH00000176